“BEACH” Stocks – Ready for a Rebound?
Dear Investor,
COVID-19 has become world’s No.1 enemy and has pushed the global economy over the edge. Since the Wuhan lockdown that was imposed on January 23, the MSCI World Index of global stocks is still down more than 5%.
Cases of newly infected people are reported daily and at the moment the numbers are approaching 230k persons per day. Many economies have suffered tremendous losses and are still facing rigid restrictions in order to constrain the spread of the virus.
In other words, the COVID-19 pandemic has turned the economy upside down.
Some of the stocks that have been hit the hardest are the so-called “BEACH” stocks (Booking, Entertainment and Live Events, Airlines, Cruises and Casinos, Hotels and Resorts). These stocks have seen more than USD 332 billion in value evaporate over the past few months.
But what happened with seasonal effects during these difficult times? Have they been erased? Or are stocks still displaying their well-known seasonal patterns?
In this issue of Seasonal Insights I will discuss two different stocks that represent cruise lines and the airline industry and show their seasonal patterns in the course of a calendar year.
Will the “BEACH” stocks make a comeback?
As many readers probably know, seasonal effects are predictable patterns that recur almost every year.
These effects serve to determine whether a short or long position in certain stocks is statistically highly likely to be profitable. The best-known seasonal drivers include investor sentiment at certain times of the year, tax or balance sheet deadlines, earning reports, the timing of interest payments or the weather, to name but a few of the factors affecting the stock prices of various companies.
Smooth sailing to recovery?
Royal Caribbean Cruises Ltd. is based in Miami Florida, United States. It is the world’s second-largest cruise line operating a large fleet of vessels. The Company operates through brands which primarily serve the contemporary, premium, and deluxe segments of the cruise vacation industry.
Royal Caribbean Cruises was one of the stocks affected the most by the COVID-19 outbreak, and its value declined dramatically. What the future will bring is difficult to predict: will it be smooth sailing to recovery for the stock?
Let us consider the statistics. The stock typically generates gains in the third and fourth quarter of the year. A detailed analysis and the period of seasonal strength can be seen in our seasonal chart below.
Unlike a standard price chart that simply shows stock prices over a specific time period, a seasonal chart depicts the average price pattern of a stock in the course of a calendar year, calculated over several years. The horizontal axis depicts the time of the year, while the vertical axis shows the level of the seasonal pattern (indexed to 100). With that in mind, let us examine the seasonal chart of Royal Caribbean Cruises, which shows the seasonal pattern of the stock over the past 10 years.
Seasonal pattern of Royal Caribbean Cruises Ltd. over the past 10 years
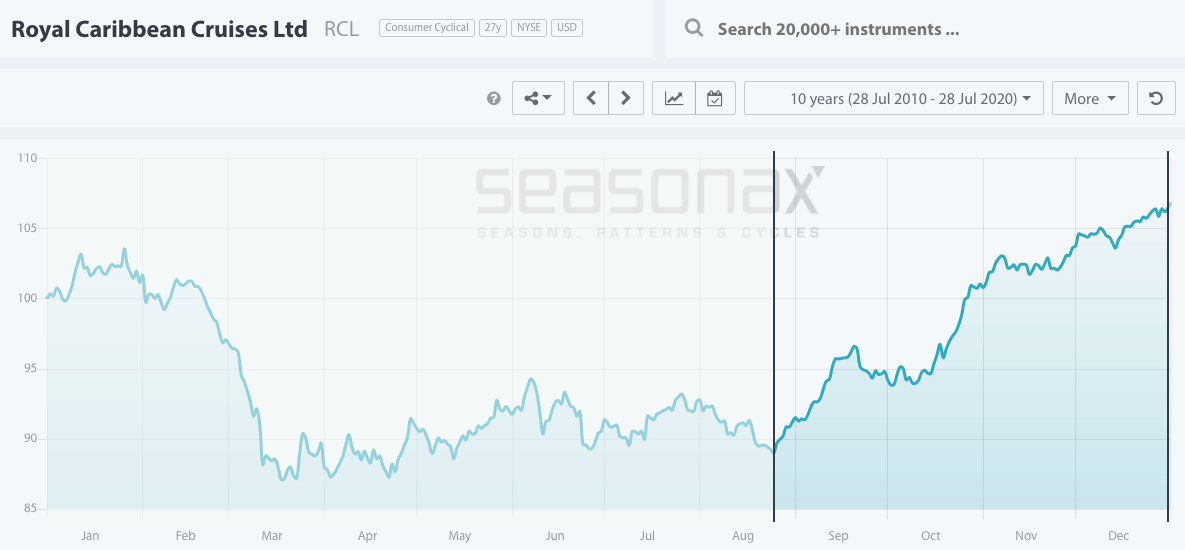
Royal Caribbean Cruises typically delivers losses during the first quarter of the year and recovers from August onward.
Source: Seasonax (click here to view the interactive seasonal chart and to choose the best investment period for the selected stock)
I have highlighted the strong seasonal phase from August 25 to December 31. On average Royal Caribbean Cruises has delivered strong returns of 22.29% during this period, which corresponds to a very respectable annualized gain of 77.40%.
Even more important is the pronounced consistency of the positive returns generated during this phase, which suggests that this pattern is highly reliable.
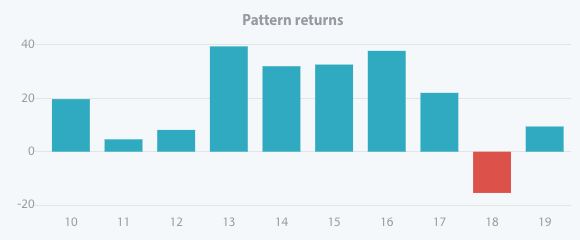
The bar chart below depicts the return delivered by Royal Caribbean Cruises in the relevant time period from August 25 to December 31 in every year since 2010. Blue bars indicate years with positive returns.
Pattern return for every year since 2010
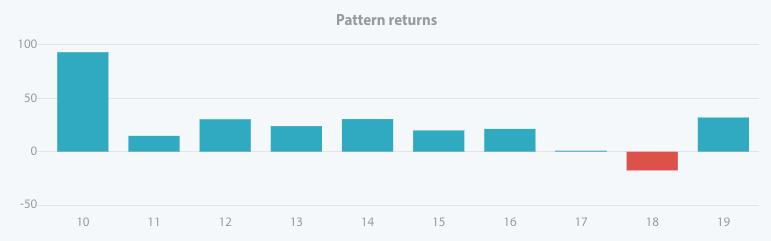
Royal Caribbean Cruises rallied in 9 out of 10 cases
Source: Seasonax (click here to view the seasonal chart)
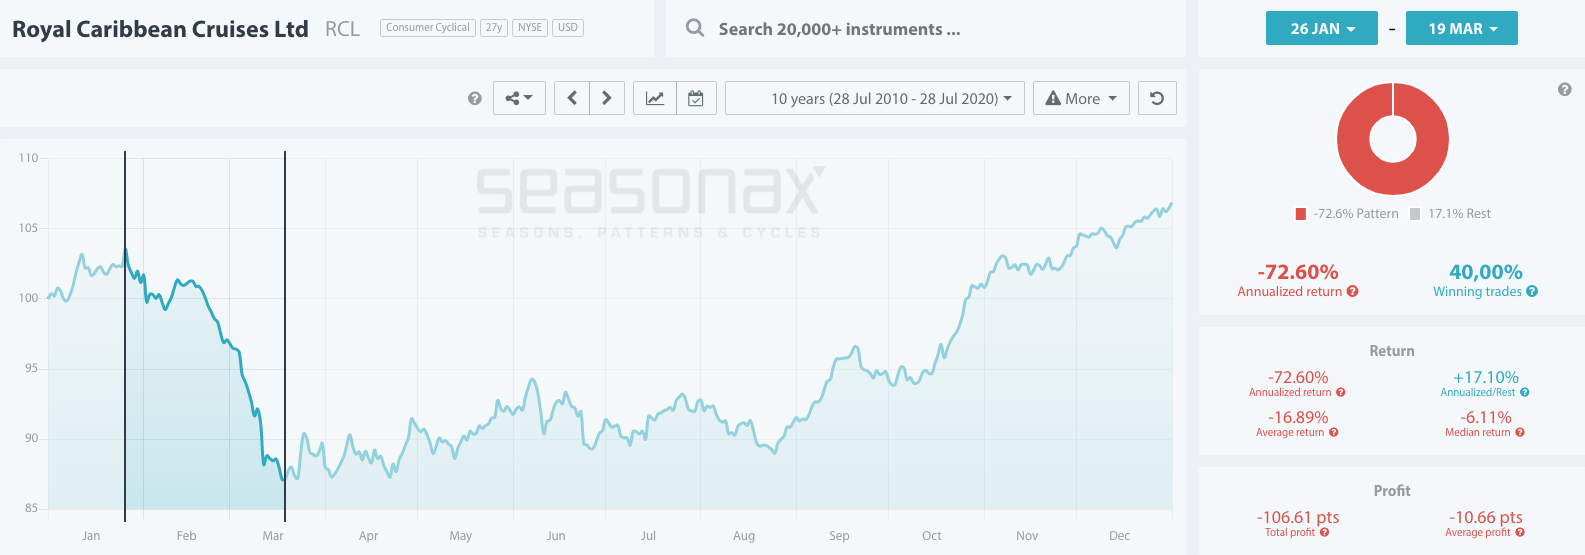
Do not forget to examine the seasonally weakest period for the stock. It did not only occur in 2020 – in fact, Royal Caribbean Cruises enters a seasonally weak phase in the first quarter almost every year.
Apart from seasonal effects, the future of the Royal Caribbean Cruises will strongly depend on the company’s ability to adapt to a “new normal”. This process will have a strong effect on the stock price and its future trend. Among the factors that will be playing a big role are safety standards. The company has already begun to proactively introduce new standards that will include a reduction of the number of passengers in order to comply with social distancing rules, while nevertheless still allowing customers to enjoy all the attractions and entertainment opportunities a cruise has to offer. Other issues Royal Caribbean will address include testing protocols, planning of sailing routes, and structural modifications to ships to improve health and hygiene standards.
Moreover, in order to regain the confidence of customers the company has introduced the “Cruise of Confidence” program, which gives customers the option of cancelling a cruise 48 hours before the sail date.
The stock’s future performance will strongly depend on how passengers will react to the new measures that have been introduced and whether this will suffice for the company to make a comeback in the second half of the year.
Is there a seasonal opportunity in airlines ahead?
Southwest Airlines is also one of the “BEACH” stocks that found itself in the crossfire during the pandemic.
So far this year Southwest has been one of the more resilient airline stocks, falling about 39% compared with a loss of 51% for the average airline stock.
Southwest runs a largely domestic network focused on leisure travellers and maintains one of the strongest balance sheets in the industry. These attributes are proving especially valuable: leisure travel has rebounded faster than business travel and long-haul international flights.
The 10-year seasonal chart of Southwest also shows a strong H2 rebound in the stock beginning in August.
Seasonal pattern of Southwest Airlines over the past 10 years
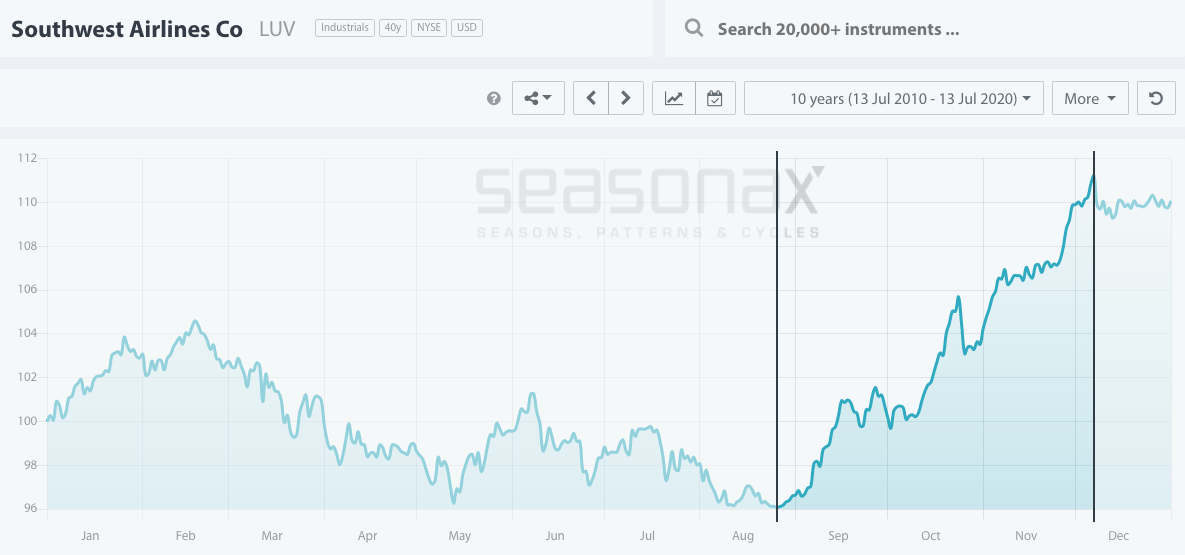
Source: Seasonax (click here to view the seasonal chart)
More precisely, the stock is entering into a seasonally favorable period from August 26 until December 7.
In this time period Southwest Airlines exhibits a particularly strong seasonal advance. The average gain achieved in this period amounted to 17.79%. This corresponds to a very strong annualized gain of 78.60%!
The bar chart below shows the returns generated in the seasonally strong period for every year since 2010.
Enter the world of seasonal opportunities
Apart from the “BEACH” stocks we have presented in this issue of Seasonal Insights there are numerous other stocks that display regularly recurring weak and strong seasonal periods.
To make finding these opportunities even easier, we have launched Seasonax Global Selection Fund. For more information, please visit Seasonax Capital.
Yours sincerely,
Tea Muratovic
Founder and Managing Partner of Seasonax Capital