Dear Investor,
With Easter only weeks away, Americans start to prepare for the celebrations, heightened by holiday spirit and good weather. But can investors also participate in this market shift and profit from any market anomalies on the horizon?
The weather plays a major role in April and is one of the best-known seasonal drivers. Sunny weather and mild April temperatures seem to have a noticeable impact on market performance by enhancing the confidence of bullish traders, which then pushes stock prices up.
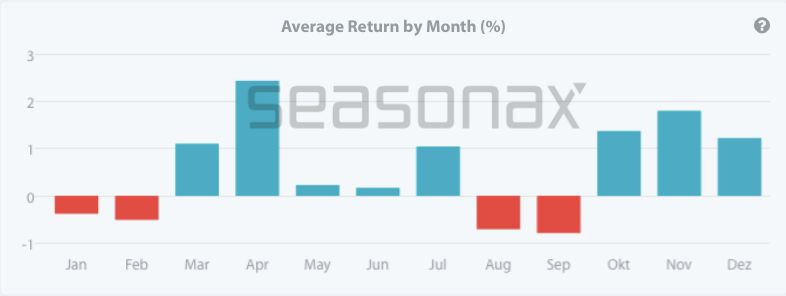
The analysis below measures the performance of the S&P 500 index in every month of the year, averaged over a 25-year period.
Average monthly return of the S&P 500 Index since 1997
http://tiny.cc/SPX500monthly
From the chart above it is clear that for decades April has been one of the best performing months. It is hard to say whether this pattern will be repeated again this year, but trading psychology is often influenced by so-called self-fulfilling prophecies.
It is not only the weather that influences traders behaviour during this month, but also the upcoming festive season. Historically, retail stocks enjoy an “Easter rally” in the early days of spring. Another fundamental factor that comes to mind is that tax refunds are reaching Americans’ bank accounts, and contribute to increased retail spending.
Before you kick start your trading activities don’t forget to seasonax the stocks on your radar.
As every holiday is a good excuse for buying, 1-800Flowers.com Inc is one of the stocks that bloom ahead of Easter. The company also owns other e-commerce operations, including Harry & David, Personalization Mall, Shari’s Berries, Fruit Bouquets and The Popcorn Factory, which all rise to the celebrations.
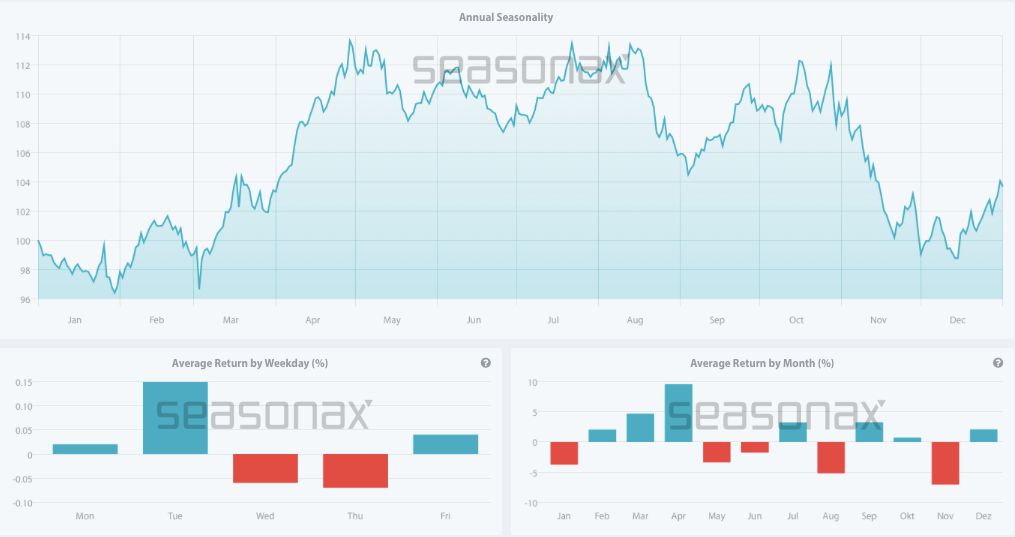
Seasonal Chart of 1-800Flowers.com over the past 15 years
http://tiny.cc/1-800Flowers-Seasonax, highlight the area in the chart to receive further analysis
Keep in mind that, unlike a standard price chart that simply shows stock prices over a specific time period, a seasonal chart depicts the average price pattern of a stock in the course of a calendar year, calculated over several years. The horizontal axis depicts the time of the year, while the vertical axis shows the level of the seasonal pattern (indexed to 100).
As can be seen on the chart above, the strong seasonal phase is quite pronounced during April. Indeed, it can be stated that April was the best performing month over the last 15 years for 1-800Flowers.com.
Don’t put all your Eggs into one Basket
When looking at different trading ideas, I can’t stress enough how important it is to diversify, diversify, and again diversify.
It might not be hard to guess that one of the retail stock that benefits from an “Easter rally” (and beyond) is Amazon. It is often seen in investors’ portfolios across the world.
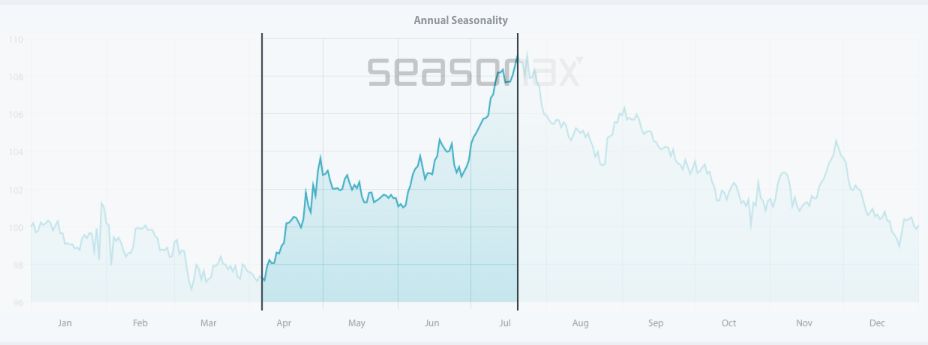
Seasonal Chart of Amazon over the past 10 years
http://tiny.cc/Amazon_Seasonax
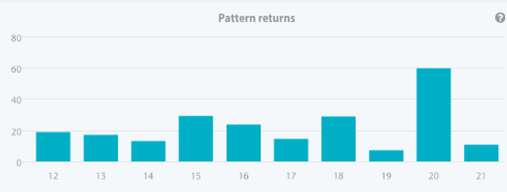
Over the past 10 years Amazon has entered into a strong seasonal period from April 6 to July 20. In this time span of 73 trading days, shares rose on average by an astonishing 21.69%. Moreover, the pattern returns since 2012 have been positive for every single year.
Pattern return for every year since 2012
http://tiny.cc/AmericanExpress_Seasonax).
Will American Express rise again this year? Or will the interest rate hikes slow US growth and harm the stock’s outlook? We will have to wait and see. But remember eventually someone always has to pay for the “party”.
If you decide to buy flowers, invest in one of our retailers, or even sweeten your Easter with companies such as Rocky Mountain Chocolate Factory, remember to seasonax it before you trade it.
To help make it even easier to identify stock opportunities, we have launched the Seasonality Screener. The screener is an analytical tool designed to find trading opportunities with above-average profit potential starting from a specific date. The algorithms behind the screener are based on predictable seasonal patterns that recur almost every calendar year.
Feel free to analyze more than 25.000+ instruments including stocks, (crypto)currencies, commodities, indexes by signing up for a free trial.
Yours sincerely,
Tea Muratovic
Co-Founder and Managing Partner of Seasonax