Dear Investor,
As a Seasonax user, you’re familiar with seasonal charts. They depict the average price movement depending on the season.
But you can differentiate even further. Individual years in the four-year US cycle have a typical pattern. The four-year cycle is also called the election cycle.
The US presidential election took place last November . The current year, 2025, is therefore a post-election year.
The election, in turn, influences stock prices even beyond election day. For the markets, the year of the four-year election cycle we are in is crucial.
The 4-year cycle has a lasting impact on the markets
The phenomenon known as the 4-year election cycle does not differentiate according to the winning party, but rather according to the year of the presidency.
The reason is suspected to be fiscal and monetary policy measures, which are influenced by politicians and monetary policy depending on the election. Presidents want to be re-elected or want a successor from their party and this results in some repeated fiscal patterns.
The typical course of the post-election year
The chart now shows you the average performance of the S&P 500 for only the post-election years. It is, in a sense, a seasonal chart, calculated only from the prices of every fourth year, the post-election years.
The chart shows you at a glance how the S&P 500 typically performs in the post-election year.
S&P 500, typical post-election performance, 1928 to 2025
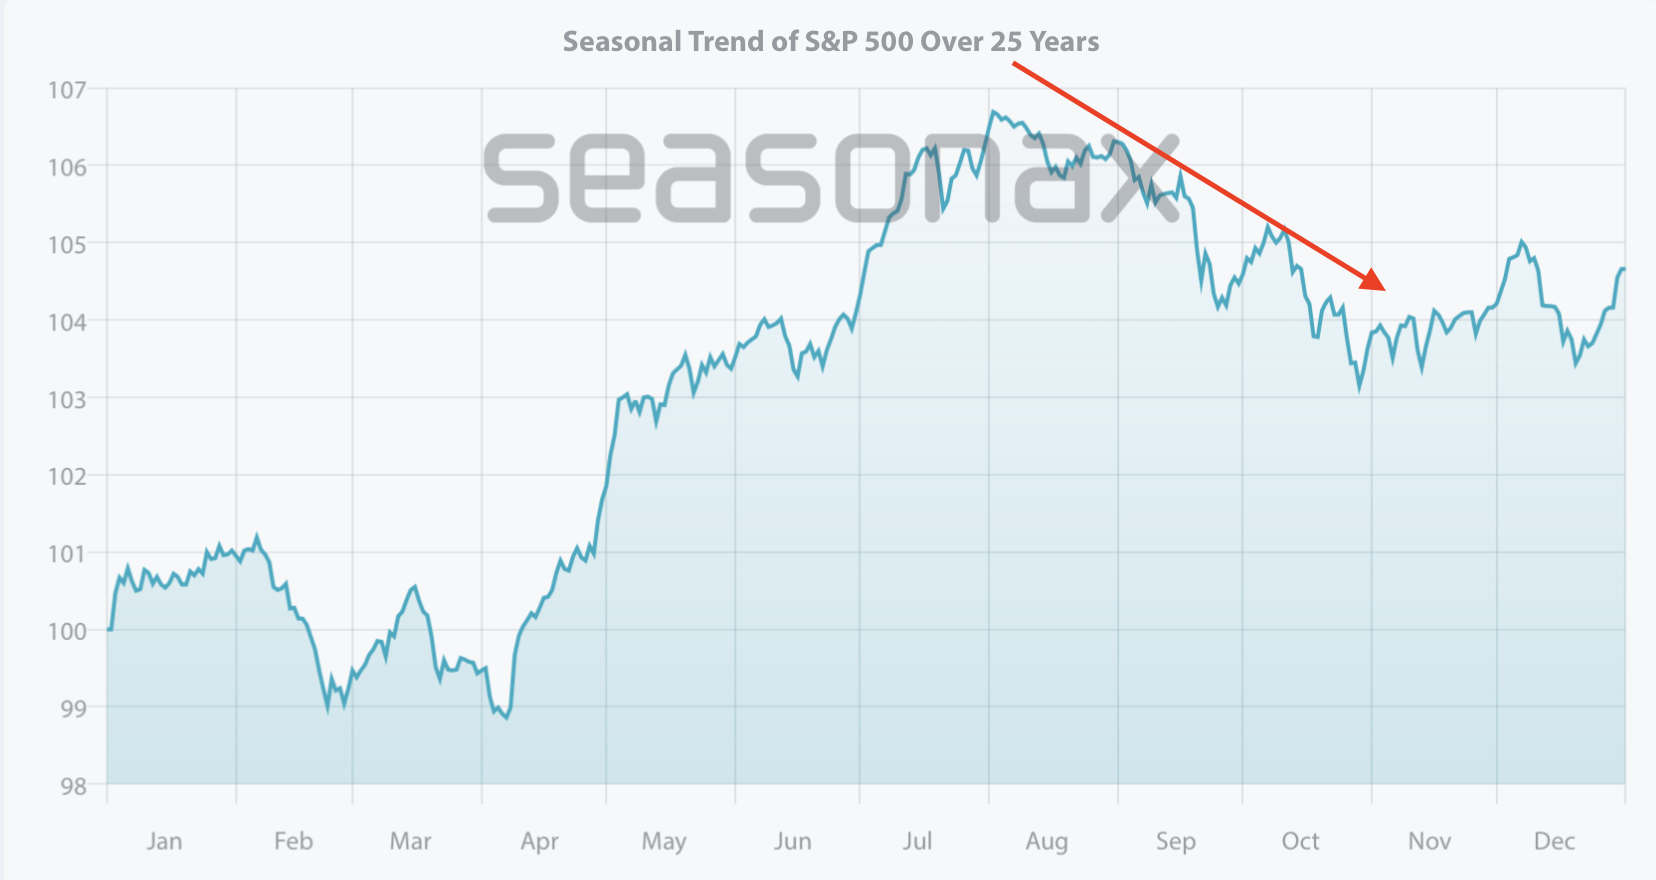
You can see how the prices peak at the turn of the month from July to August and then fall (see arrow on chart). September is particularly weak.
September is a weak month even in the normal course of the year, but this is now confirmed for the US post-election year as well. Moreover, prices remain at a lower average level in the post-election year. Furthermore, an autumn rally like in other years is unlikely to occur.
However, as an investor, you don’t need to despair. You can also consider other investments like gold, or short positions, or focus even more on seasonally good instruments when selecting stocks. The Seasonax screener and our suggestions on the Seasonax website will help you with this.
Use the filter function!
Seasonax offers you more than just annual seasonality. If you want to know how an instrument performs in a four-year cycle or another cycle, you should use Seasonax’s filter function !
Filter function on Seasonax, with marked election cycle
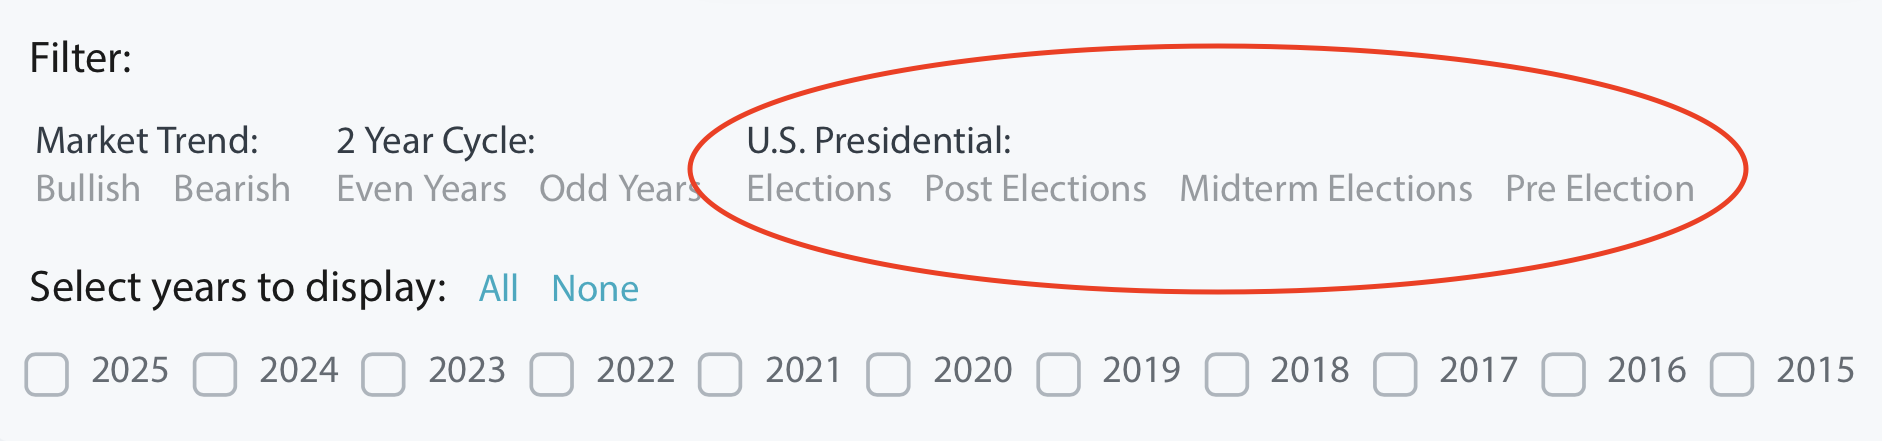
This allows you to quickly see not only the annual seasonality but also the typical trend of special years such as the post-election year for all instruments with just a few clicks.
Try it out!
Best regards,
Dimitri Speck
Founder and Chief Analyst of Seasonax
PS: You can use Seasonax for everything from annual seasonality to more complex analyses!