Dear Investor,
Technology stocks often dominate the headlines during the first half of the year. Yet, once July arrives, history suggests leadership frequently begins to rotate. So, instead of chasing the year’s biggest winners, institutional investors have often shifted toward sectors offering more predictable earnings and defensive characteristics.
Healthcare has historically been one of those sectors.
UnitedHealth Shows Strong July Seasonality
The chart below shows that over the last 15 years, UnitedHealth (UNH) has produced an average return of +2.43% from 8 July to 23 July, with a 73.33% win rate and an impressive annualized return of +78.69%.
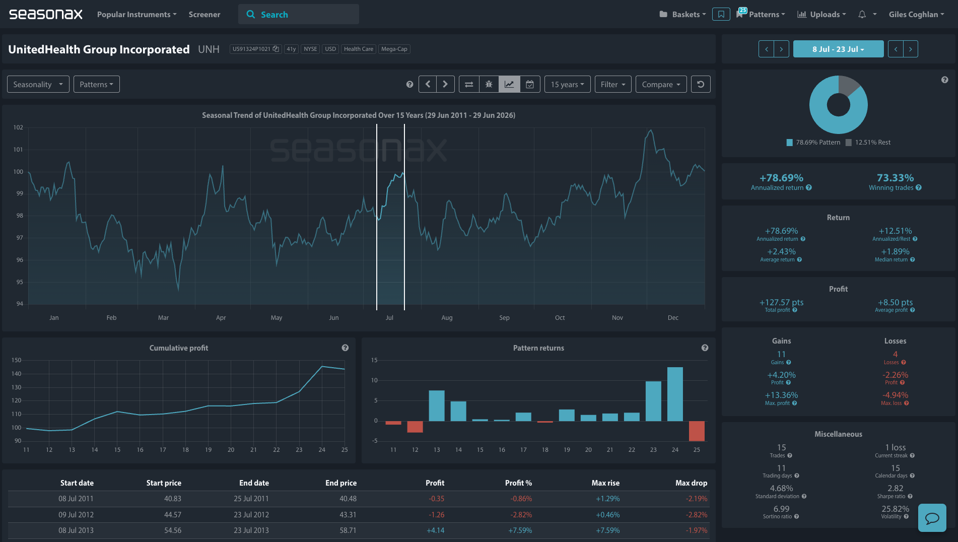
Perhaps most encouraging is the pattern distribution. Eleven of the past fifteen years have delivered gains during this seasonal window, while the cumulative profit curve has steadily risen over time, suggesting this has been a consistent period of strength rather than one driven by only a handful of exceptional years.
The Broader Healthcare Sector Confirms the Trend
Now, this isn’t simply a UnitedHealth story.
The chart below shows that the Health Care Select Sector SPDR Fund (XLV), which tracks the healthcare companies that make up the S&P 500, has generated an average return of +1.82% between 9 July and 28 July, with an 80% winning trade percentage and an annualized return of +41.72% over the past 15 years.
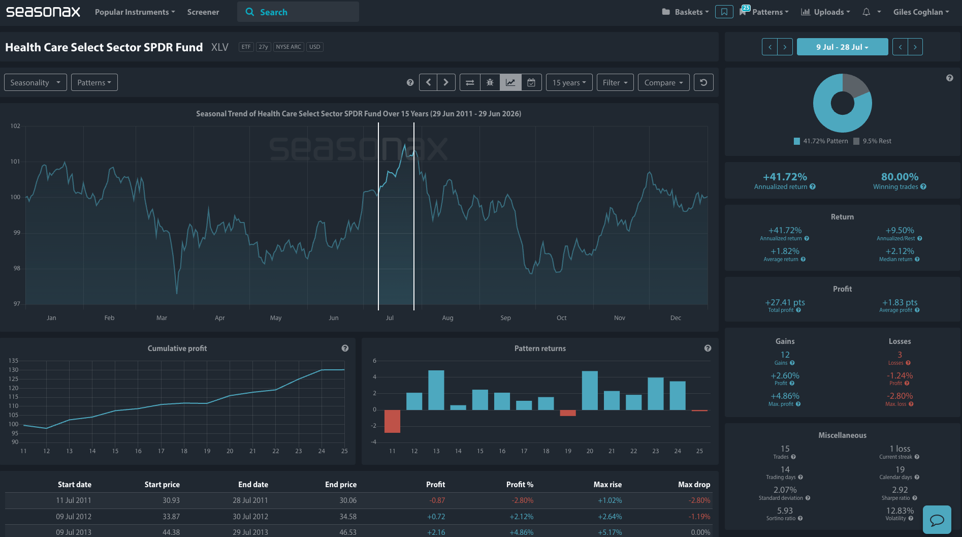
The cumulative profit curve continues to trend steadily higher, while the pattern return distribution shows gains across most years rather than isolated spikes. This suggests institutional buying has historically been broad-based across the healthcare sector during mid-summer. The standard deviation is relatively low at 2.07% which shows that the pattern’s volatility is stable.
Johnson & Johnson Adds Further Confirmation
A very similar the seasonal tendency can also be seen in one of healthcare’s most established companies. Johnson & Johnson is one of the world’s largest healthcare companies, developing and selling a broad range of prescription medicines and medical technologies used to treat millions of patients every year.
The chart below shows that over the last 15 years, Johnson & Johnson has returned an average of +2.66% between 30 June and 29 July, producing gains in 73.33% of observations and an annualized return of +39.21%.
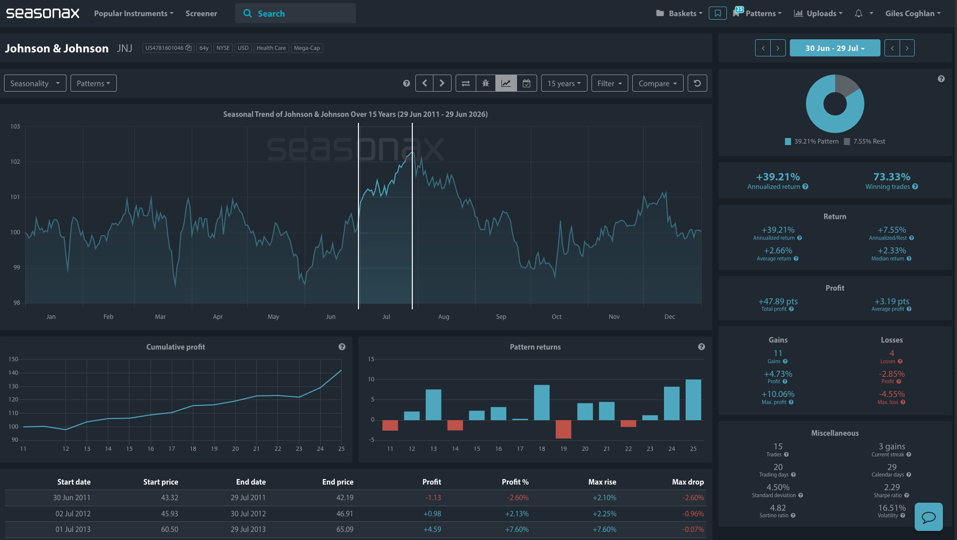
Once again, the cumulative profit curve trends consistently higher, reinforcing the view that this is a recurring seasonal phenomenon across multiple healthcare names rather than an isolated company-specific event.
So, Why Do Healthcare Names Often Strengthen During July?
Several factors may help explain this recurring seasonal tendency.
Following the first-half rally, portfolio managers often rebalance away from higher-beta sectors into businesses offering more stable earnings visibility. Healthcare naturally benefits from this shift. Unlike many cyclical sectors, demand for healthcare products and services remains relatively stable regardless of economic conditions. Investors often become more selective during the quieter summer months, favouring companies with predictable cash flows and resilient earnings. At the same time, long-term structural themes continue to support the sector.
According to Reuters GLP-1 obesity and diabetes treatments continue to reshape the pharmaceutical industry, while innovation in oncology, immunology, and medical devices remains a major source of long-term growth.
These drivers likely provide an additional layer of support beyond the seasonal pattern itself.
Trade Risks and Opportunities
Now, no seasonal tendency is guaranteed and this is no exception. Some major potential headwinds include:
- Rising Treasury yields reducing demand for defensive sectors.
- Political or regulatory headlines surrounding healthcare reimbursement or drug pricing.
- Disappointing earnings or clinical trial updates from major pharmaceutical companies.
- A sharp risk-on rally that draws investors back toward higher-beta technology stocks.
However, the opportunities remain compelling.
Healthcare combines defensive earnings, long-term structural growth, and one of the more consistent seasonal windows of the summer. Taken individually, none of these patterns would be especially persuasive. However, when three separate healthcare instruments all display similar seasonal strength, confidence naturally increases. While no seasonal tendency is guaranteed, history suggests healthcare deserves a place on investors’ watchlists as July begins.
Use Seasonax for your professional handling of market-moving seasonal trends!
Don’t just trade it, Seasonax it.
Giles Coghlan, CMT
Macro Strategist Seasonax