- Instrument: Gold
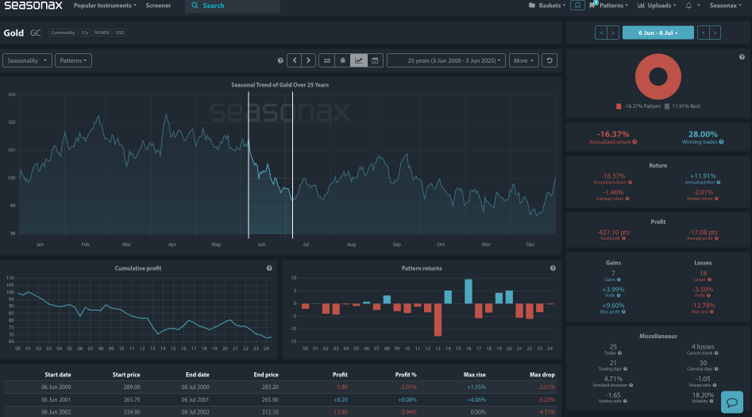
- Average Pattern Move: -1.46%
- Timeframe: June 6 – July 6
- Winning Percentage: 28.00%
Dear Investor,
You may not realise that June is statistically the weakest month of the year for gold.
The latest Seasonax data covering 25 years of price behaviour shows gold tends to slide between June 6 and July 6, with an average loss of -1.46% and a very low winning percentage of just 28%. This period has produced a negative return in 18 out of 25 years, suggesting strong seasonal headwinds could soon emerge. We want to analyse the data in more detail.
The Seasonal Setup
The chart shows you the typical development of gold prices between early June and early July. The pattern highlights persistent downside pressure and a poor reward-to-risk profile for longs during this window. This has led to a pronounced seasonal drawdown—one that coincides with historically quieter trading volumes and weak physical demand in the mid-year lull.
Technical Perspective
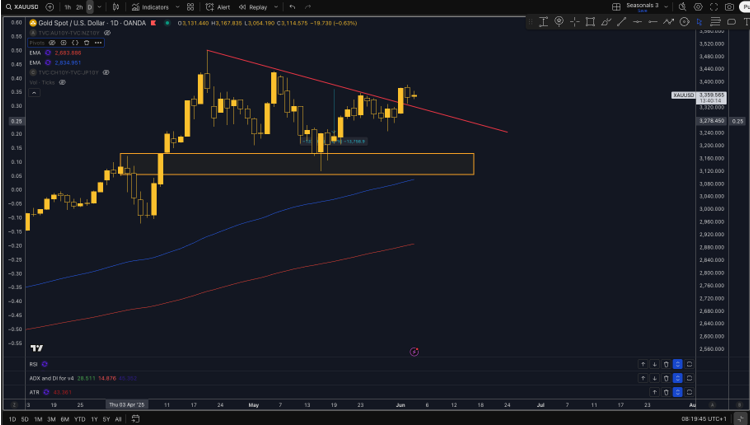
Technically, gold has broken out of its descending trendline on June 02 and is currently consolidating above it. While that looks bullish in the short term, the downside gap left below $3,100 could serve as a magnet for price, especially if macro conditions soften or yields rise again. There’s also key dynamic support around the $3,000 area, just above the swing low from April. That could act as the line in the sand for dip-buyers.
Trade Risks
The seasonal dip in gold is well established, but macro factors—particularly a surprise Fed dovish pivot or risk-off shock—could override this trend. Additionally, the breakout above the trend line may embolden momentum traders in the short term.
Use Seasonax for your professional handling of market-moving events! Sign up and try out Seasonax for 30 days for free!