


The Midterm-Year Rally in Gold
Gold follows the same 4-year cycle as stocks. Since 1968, midterm years like 2026 have delivered their best average return by far, reaching 11.09% on average, with the rally typically taking hold from July onward.
Gold follows the same 4-year cycle as stocks. Since 1968, midterm years like 2026 have delivered their best average return by far, reaching 11.09% on average, with the rally typically taking hold from July onward.
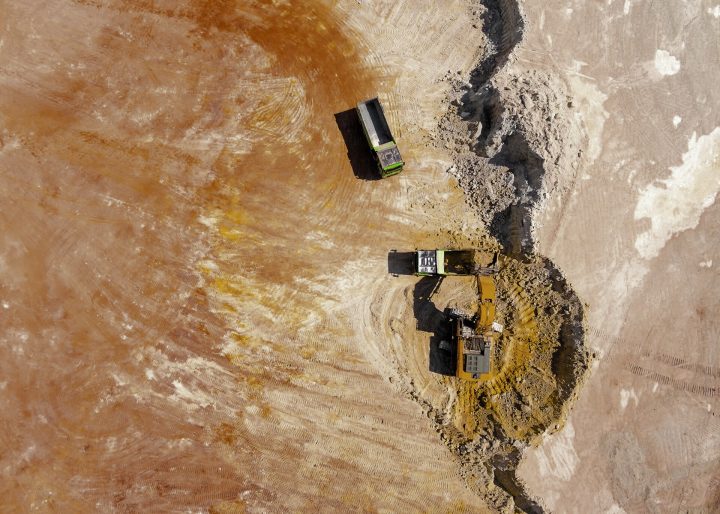
Periods that are historically difficult for stocks can reveal different dynamics in gold. By examining long-term seasonality and the four-year cycle, gold’s performance is placed into a broader market context that helps frame market behavior over time.

Gold typically enters its strongest seasonal phase in the second half of the year, with consistent gains driven by rising jewelry demand. Over the past 25 years, it has delivered an average return of nearly 10% during this period, making seasonality a powerful factor to consider when investing in gold.

June has historically been a challenging month for gold. Data shows a consistent drop between June 6 and July 6, with an average decline of -1.46% and gains in just 28% of years. This weakness often aligns with lower physical demand and subdued trading activity. While a recent breakout may appear bullish, seasonal trends still warrant caution.
Gold has been a strong performer this year, driven by geopolitical risks and central bank demand, yet history shows June tends to be the weakest month for gold prices. According to a 25-year Seasonax study, gold averages a loss of 0.8% from June 1 to July 1, with only a 40% chance of gains during this period. This downturn is often linked to reduced physical demand and a lull in global jewelry consumption.

Discover the "Santa Claus Rally," a seasonal phenomenon with a history of boosting stock prices during the holiday season. Learn how it impacts markets like the S&P 500 and DAX, and what factors could influence this year's rally.
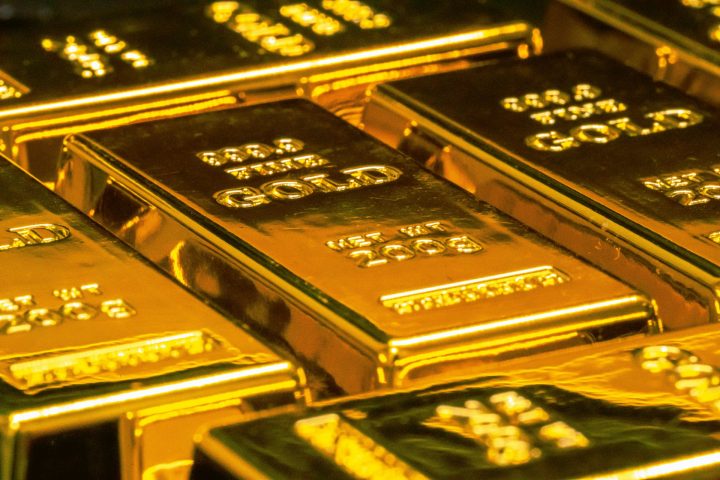
Gold has gained 50% in two years, but Newmont Mining has lagged behind. Seasonality shows its strongest phase is from November 27th to April 11th, with an average gain of 24.04%. Could now be the time to catch up?
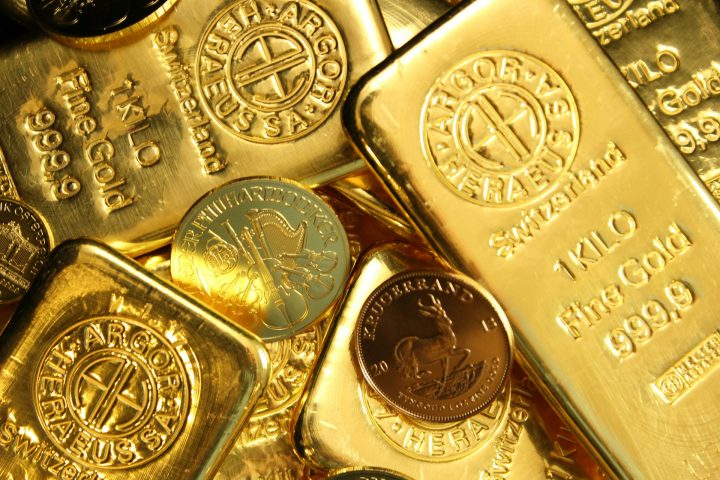
Around 50% of current gold production flows into jewelry production. This has a considerable influence on the price of gold. The Indian wedding season in autumn, the Christmas season and the Chinese New Year increase the demand for gold for jewelry production, with purchases by jewelers taking place in the run-up to the respective festivities.

Gold serves as a renowned inflation hedge due to its intrinsic properties and historical performance during periods of rising prices. Gold operates as an inflation hedge as gold possesses inherent value that transcends currencies and economic fluctuations.

Over the last 5 years gold has risen into and out of US CPI prints 60% of the time for an average 0.28% gain. Interestingly, the largest gain on a US CPI print in gold has been 3.11%. So, if we see a big miss in the US CPI print with the CPI MM 0.10% or lower, the Core CPI MM 0.10% or lower, the headline 3% or lower, and the CORE CPI 3.7% or lower then watch out for gold gains!

Has the Fed just given the green light for gold to gain into the start of 2024? With a dovish dot plot forecasting 3 Fed rate cuts next year bonds were heavily bought last night and the USD was convincingly sold.

