- Instrument: Gold (GC)
- Average Pattern Move: -0.80%
- Timeframe: June 1 – July 1
- Winning Percentage: 40.00%
Dear Investor,
Gold has been a standout performer so far this year, driven by persistent geopolitical risks, central bank buying, and concerns over the long-term fiscal health of major economies. Yet as we transition into June, it’s worth paying attention to one key historical insight: June is historically the weakest month of the year for gold. We want to analyze the data in more detail.
Seasonal Weakness into July
The Seasonax 25-year study highlights that from June 1 through July 1, gold has returned an average of -0.80% with a low winning percentage of just 40%. That’s the worst average return of any month in the calendar year. In fact, over the last 25 years, this stretch has produced losses in 15 out of 25 instances.
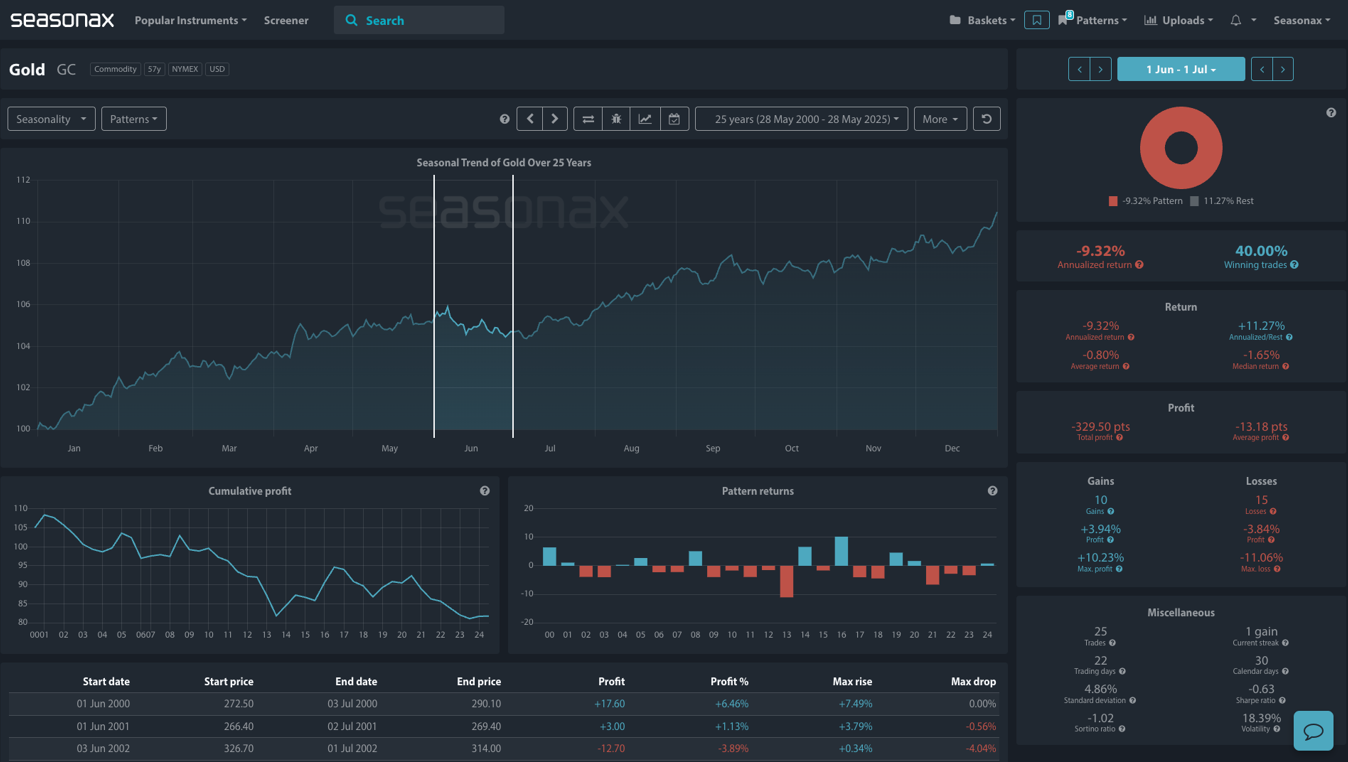
The chart above shows you the typical development of the gold price over this 30-day window, and it paints a clear pattern of seasonal softness. This trend is often attributed to slower physical demand during the Northern Hemisphere summer and a lull in global jewellery consumption before the autumn wedding season in Asia.
Macro Context: Positioning and Real Yields Matter
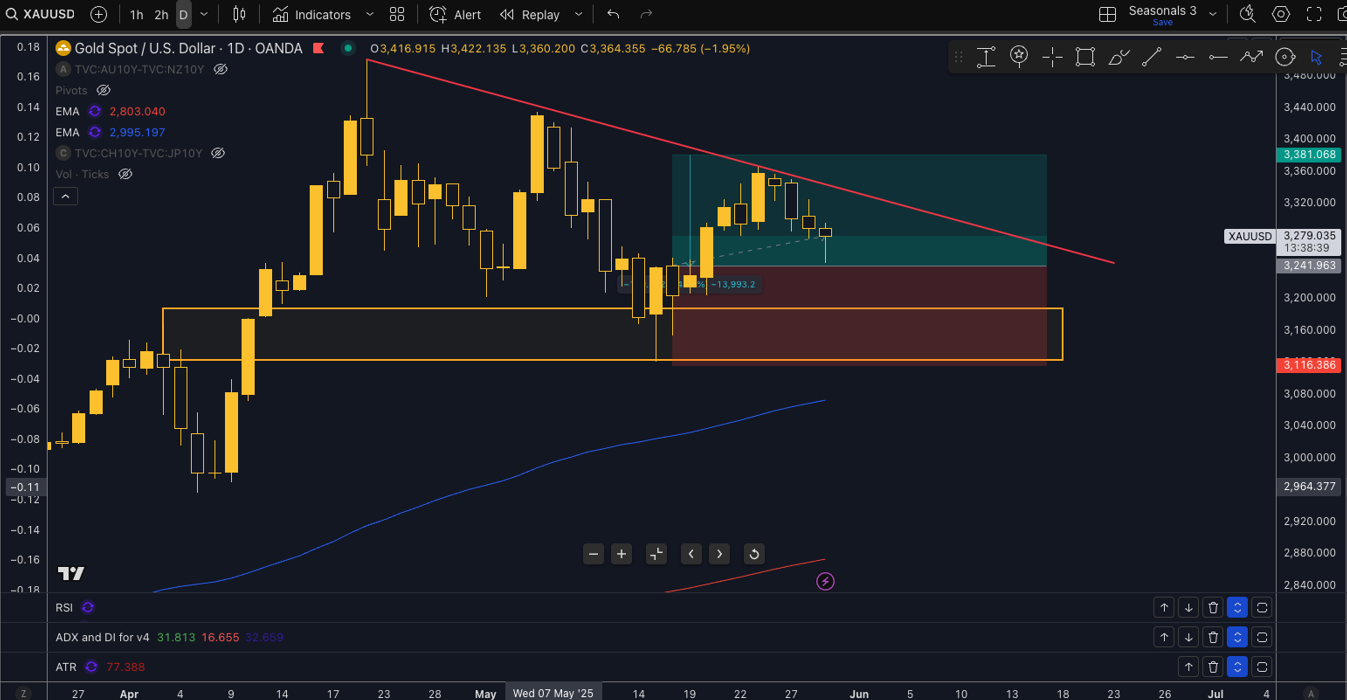
While demand from global central banks remains strong, speculative positioning in gold has become crowded, and any reversal in Treasury yields or dollar strength can easily prompt a corrective move lower. The recent rally above $3,400 has also pushed gold into technically stretched territory, making it vulnerable to profit-taking.
Technical Analysis: Trend line Pressure Builds
The technicals support the seasonal picture. As shown in the accompanying chart, gold is currently struggling to maintain momentum above the $3,400 level, having formed lower highs beneath a descending trendline. Watch for price action to fall back into a defined consolidation box between $3,120 and $3,190. A break below $3,110 could open the door to a deeper correction into the $3,000 zone.
Use Seasonax for your professional handling of market-moving events! Sign up here!
Trade Risks
The primary risk to this outlook would be a renewed geopolitical shock or a surprise dovish shift from the Fed, which could trigger another upside break despite the seasonal headwinds. Additionally, strong central bank purchases or weak US economic data could reignite demand for gold as a safe haven.