Dear Investor,
Perhaps you are wondering whether strong returns can be generated with the help of seasonality. It is after all a fairly simple method – at least at first glance. Thousands of analysts and computer programs are continually searching for anomalies in order to find profitable stock market trades. In view of these efforts, is it actually possible to beat the market with the aid of a calendar-based system?
Today I therefore want to discuss a simple example that highlights how stable seasonal patterns can be – namely the “Halloween effect”.
The classical Halloween Effect has been working for years
You are undoubtedly familiar with the saying “Sell in May and go away!” It is probably the best-known stock market adage related to seasonality – in fact, it may well be one of the oldest stock market sayings in existence. It refers to what is also known as the “Halloween Effect”.
The chart below shows the gains one would have accumulated by following the rule since 1960. The blue line shows the cumulative percentage return that an investment in the Dow Jones Industrial Average (DJIA) would have achieved from November to April – i.e., if the rule had been heeded. For comparison, the red line shows the cumulative return of an investment in the DJIA during the summer months.
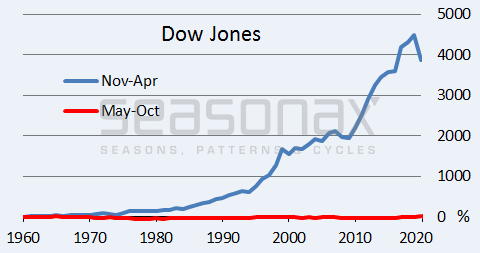
Almost the entire gain of the DJIA was generated in the winter months. Source: Seasonax
Practically the entire performance over the sixty years under review was achieved during the seasonally strong part of the year. By contrast, in the seasonally weak months one could just as well have stayed out of the market entirely.
“Sell in May” – it rings true
Evidently a seasonal relationship can indeed be stable for a very long time. Of course, some years turn out to be exceptions and what’s more, seasonal patterns can change.
However, no correlation in stock markets is valid at all times. Ultimately one has to operate on the basis of probabilities – and in this context seasonality makes an important contribution.
As an aside, the saying “Sell in May and go away!” has been known since at least the 1930s and is thus actually many decades old. The phenomenon nevertheless remains in effect to this day – despite all those busy analysts and computer programs. It also applies internationally, as the next example illustrates.
Does the Halloween Effect apply globally?
As noted above, seasonal patterns can change over the years. Precise analysis is therefore very important.
The next chart shows the annual seasonal pattern of the MSCI World stock index. This is not a standard price chart, but a seasonal chart depicting the average performance of the MSCI World Index in the course of a calendar year. The horizontal axis shows the time of year, while the vertical axis shows the average percentage moves of the past 20 years. The seasonal trends of the index are therefore discernible at a glance.
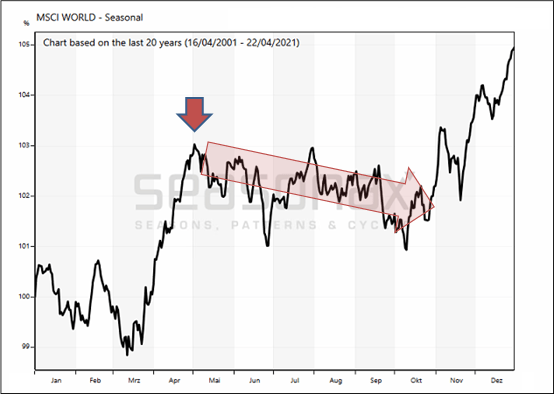
The weak phase in stocks starts precisely at the beginning of May. Source: Seasonax
As the chart shows, the MSCI World reverses to the downside almost precisely from the beginning of May. The phase of weakness the saying “Sell in May and go away” refers to follows on the heels of this reversal. It ends after almost (but not quite) half a year. From a seasonal perspective the probability of stock market weakness is therefore elevated in coming months.
Sell in May” also applies to the German DAX Index
What then about individual non-US stock market indexes, such as the German DAX? Over the past 61 years, the DAX declined by an average of 0.67 percent in the summer half-year between 01 May and 31 October. However, overall the DAX gained on average nearly 6 percent p.a. in the 61 years under review – on average the gains in German stocks were therefore achieved exclusively in the winter half-year.
The bar chart below shows the return of the DAX Index between 01 May and 31 October for every year from 1960 to 2020. Green bars depict years in which prices increased, red bars show years in which prices declined.
DAX, percentage return between 01 May and 31 October in every year since 1960

Losses of up to 36.5% were recorded! Source: Seasonax
Evidently, the color red is not dominant. The DAX declined in its seasonally weak phase in just 28 of the 61 cases examined. Declines in the summer half-year are not more frequent than rallies, but in sum they are stronger.
The weak “Sell-in-May” phase is about to begin – Be on your toes!
The seasonal phase of weakness in stock markets is about to begin – considerable caution is therefore warranted. The weak phase starts earlier in some indexes and later in others – these details can be examined at www.seasonax.com.
A more multi-layered picture is in evidence in individual stocks. Some individual stocks actually have weak seasonal phases at completely different times of the year.
Conclusion: it is basically more dangerous to hold stocks from the beginning of May onward as opposed to holding them from early November onward. However, numerous individual stocks exhibit different seasonal patterns – many actually offer great opportunities from May onward as well.
Yours sincerely,
Dimitri Speck
Founder and Head Analyst of Seasonax
PS: “Sell-in-May” applies to many – but not all – stocks!