Dear Investor,
Starting with some good news: we will be significantly expanding the range of events on offer in the next few days! 36 new events are going to be added to the existing 82, so that you will be able to examine the prices of all instruments on a total of 118 events, including economic figures or central bank meetings.
This is a good reason to look at a classic event study in this edition of Seasonal Insights: the FED meeting.
The Federal Open Market Committee (FOMC) of the US Federal Reserve meets eight times a year to discuss monetary policy, and to decide on the level of key interest rates.
The next Fed meeting will take place in just over a week, from April 30 to May 1. In view of a higher-than-expected inflation rate, many investors are wondering whether the Fed will signal interest rate cuts this time, and by how much, and what this means for share prices.
FED meetings boost the stock market!
Most investors are looking intently at the central bankers’ decision and what it signals.
Statistically, however, the relevant price movements occur in advance. And you can take advantage of them!
Take a look at the corresponding event chart. It shows the average performance of the S&P 500 in the ten trading days before and after the second day of the FED meeting over the past 25 years, or 200 FED meetings. The red line in the middle marks the second day of the FED meeting.
You can see, at a glance in the event chart, what the typical course of US share prices looks like around the important central bank meeting.
Average performance of the S&P 500 10 trading days before and after the second day of the FED meeting (1999 to 2023)
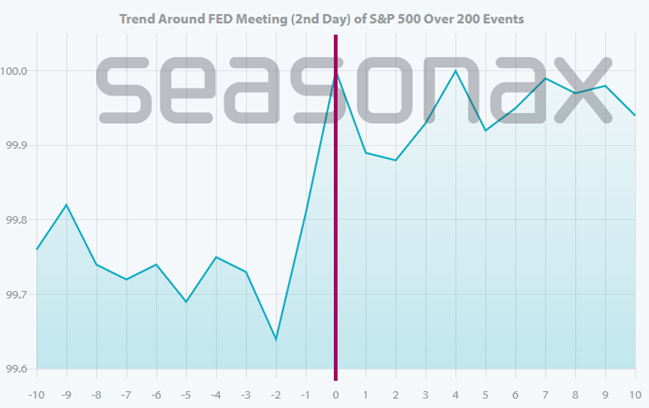
The S&P 500 rises particularly strongly in the two preceding days. Source: Seasonax
As is apparent here, share prices were already rising in the run-up to the announcement of the outcome of the FED meeting, and significantly so!
Despite high volatility, the subsequent price movements were only sideways on average.
The statistically relevant and usable price movement therefore takes place in the run-up to the FED meeting. Most investors, on the other hand, pay attention to the time after the FED meeting. However, this movement is hardly usable for investors in the long term.
The two days leading up to the meeting are exceptionally solid!
In the two days leading up to the second day of the FED meeting, the S&P 500 rose by an average of 0.36%. This may seem small at first glance, but remember: calculated over the year, this corresponds to 66.55%! After all, the rise occurred in just two days. These two days therefore rose more than six times more than all days in the S&P 500 (including these two days) on average over these 25 years.
The increase has been fairly even. Take a look at the cumulative profit curve, for example. It illustrates the earnings trend:
Capital yield curve of the “two days to the FED meeting” event
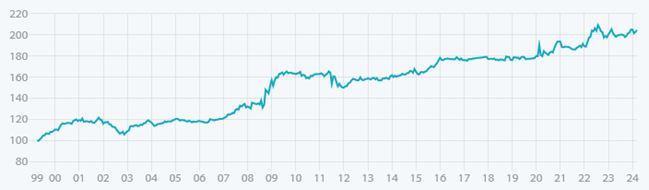
The yield trend was very good in 2022. Source: Seasonax
The stability of the pattern is also very positive. It has been profitable for many years. It was also published prominently in a scientific journal in 2011. It is therefore well known in professional circles, and there have been many hedge funds and other investors who may have arbitraged it. Yet it continues to work!
How to use event studies!
As a trader, you can trade this pattern directly. Alternatively, you can also use it as a filter: Statistically speaking, it is better not to go short on these two days.
If you have a longer-term view, use it to optimize your entry time: buy shares on the day before the FED meeting, and not immediately after the announcement of the meeting result.
There are far more usable events!
However, events also have an impact on many other instruments. For example, the euro against the US dollar also has a typical pattern around the FED meeting. Very few investors are aware of this.
Moreover, the FED meeting is just one of many events. There are many more, some of which last much longer.
What about interest rate cuts by the FED? Or with reports such as the CPI or labor market data? What about futures expiry dates such as witching days? How do prices behave at the start of a quarter?
You can check your instrument for events in seconds!
You can quickly answer all these questions, and many more, with our event tool.
You can combine all events with all instruments – indices, individual shares, currencies or commodities.
This is done with just a few mouse clicks.
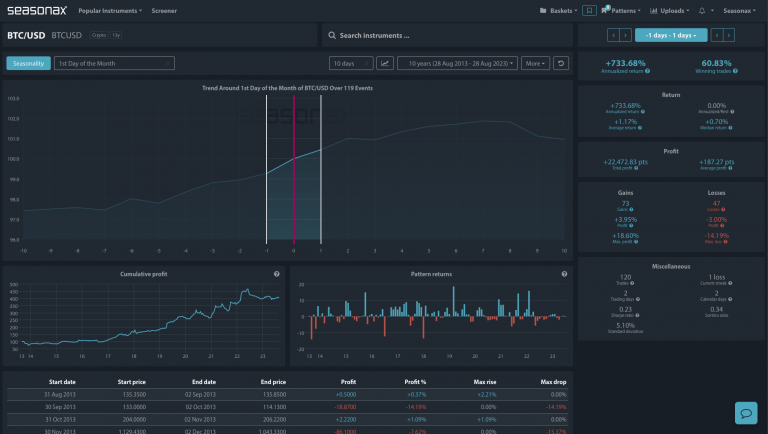
The event button can be found at the top left after calling up a seasonal chart for a specific instrument such as the S&P 500.
Screenshot, excerpt, from Seasonax
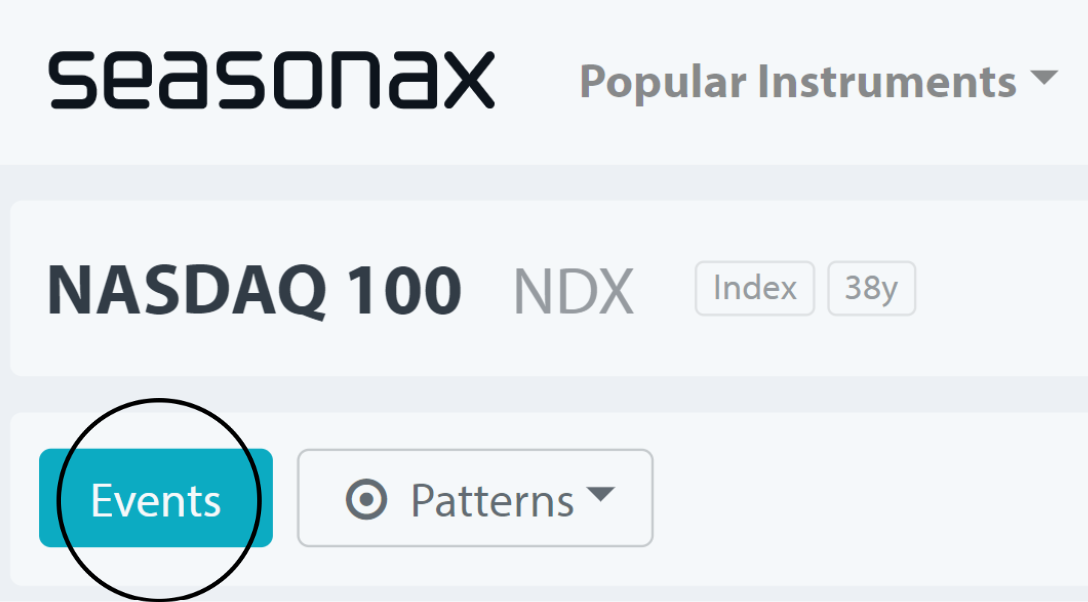
The events are easy to find. Source: Seasonax
You can then select the event that interests you personally, such as the FED meeting, from the drop-down menu.
We expanded the range of events for you!
As mentioned at the beginning, we are expanding our range of events for you.
In future, 118 events will be available to you.
You will receive a separate email in the next few days.
As usual with Seasonax, this extension does not involve any additional costs for you.
However, the number of events available depends on the subscription plan you choose.
All events are therefore freely available to business users. This also applies to the new events.
A reduced number of events is available for basic users.
If you have the basic subscription: We will be sending you a separate email in the next few days with a discounted upgrade offer that you can hardly refuse. Take advantage of it to be able to use the full range of Seasonax functions!
Best regards,
Dimitri Speck
Founder and Chief Analyst of Seasonax
PS: Look forward to the new event studies!