Dear Investor,
For many investors, the rise in share prices this year came as a surprise.
However, the year before the election of a U.S. president often sees sharp rises on the stock markets.
With the first half of the year going so well for stock owners, you may well be asking yourself: what happens next?
The election cycle influences the markets
Along with annual seasonality, the four-year cycle is one of the most important cycles on the U.S. stock market. This cycle is also called the election cycle because it is related to the election of the U.S. president.
Presidents want to be re-elected or want a successor from their party. This means that before the election they try to stimulate the economy and make voters feel positive. This includes measures financed by deficit spending. Loose policies boost the markets.
On the other hand, after the election unpopular measures, such as those against a ballooning government deficit, are more frequent. This puts pressure on share prices. The tightening of monetary policy then threatens again.
This is how the four-year cycle on the stock markets comes about.
The phenomenon thus differentiates not by party, as many believe, but by the year of presidency.
The pre-election year is the best!
In the 123 years between 1900 and 2022, the Dow Jones rose an average of 5.89% if it was a presidential election year. In the pre-election years, it performed even better with 9.03%. In the post-election years, on the other hand, it was only 4.70%, and in the subsequent mid-term election years even only 0.66%.
The good performance of the 2023 pre-election year so far was to be expected in terms of the four-year cycle. After all, the next election is in 2024.
So what happens after the election cycle in the second half of the year?
The typical course of the pre-election year
For this purpose, the chart below shows you the average course of only the pre-election years. In a sense it is a seasonal chart, in which only every fourth year is taken into account.
It was calculated from the average of the returns of the 31 years preceding the U.S. presidential election. The horizontal axis shows the time in the year, the vertical axis the level of the seasonal index. This allows you to see at a glance how the pre-election year typically plays out.
Dow Jones, typical pattern of pre-election years, 1903 to 2019
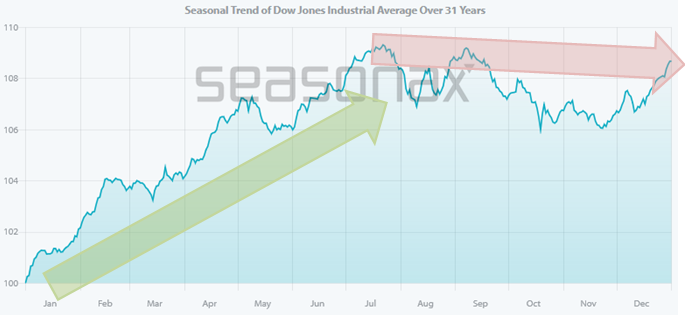
The gains occur in the first half of the year. Source: Seasonax
You can see the good performance of the pre-election years. But: it occurs in the first half of the year!
The second half of the year is characterized by a decline up to the end of November, before picking up again at the end of the year.
How to use the filter function on Seasonax
As you can tell, the election cycle in the first half of 2023 provided good guidance for stocks. You also see that with Seasonax you examine more than mere annual seasonality.
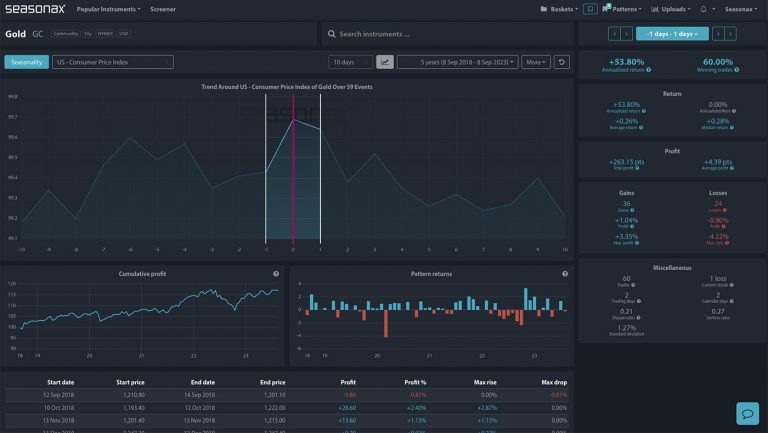
If you want to examine the election cycle yourself, simply call up the filter function at www.seasonax.com via the “More” menu item.
Filter function

One click to the election cycle. Source: Seasonax
You will then be able to see at a glance how rates typically develop in each year of the election cycle!
Warm regards,
Dimitri Speck
Founder and Head Analyst of Seasonax
PS: The election cycle has an impact on stock prices!