Dear Investor,
The “turn of the month” effect has frequently been studied in relation to the U.S. stock markets. It shows that stocks tend to rise more around the turn of the month than around the middle of the month.
The context to this pattern is that regular income from salaries is received at this time. This is then invested on the stock market around the turn of the month via saving plans.
But what about other stock markets, and commodities?
With the help of Seasonax’s recently introduced event studies, you can find this out in just a few mouse clicks.
Important note:
We have decided to provide users of Seasonax the event studies without additional fees.
All seasonal analysis tools, from charts to evaluations, to the screener and individual functions, are of course still available to you.
If you are not yet using Seasonax, now is the best time to try it out here.
So, how do you investigate the “Turn of the Month” effect for gold with just a few mouse clicks?
How to find the “Turn of the Month” effect in gold!
Select “Gold” via the search function, or in the menu under “Popular Instruments”.
Click on “Events” in the upper left corner of the chart.
Select the 1st Day of the Month event from the drop-down menu. This maps the “Turn of the Month” effect.
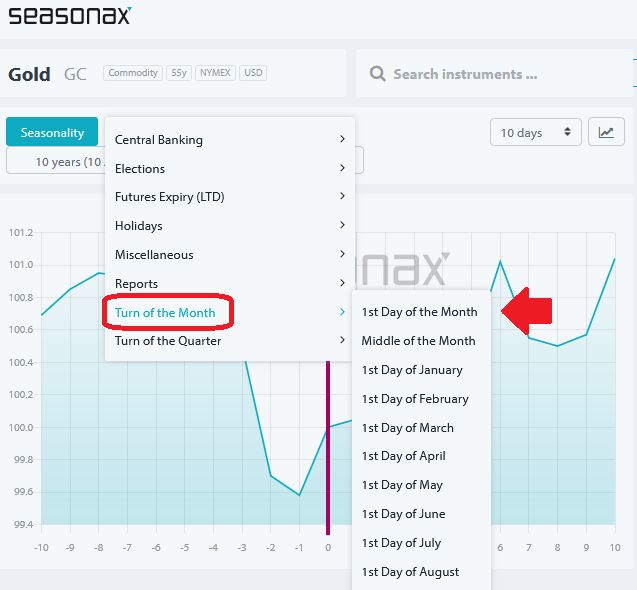
Immediately the “Turn of the Month” chart appears. It shows you the average price trend of the instrument around the “1st Day of the Month”. The red line in the middle marks the event, and to the left and right of it you can see the trading days before and after.
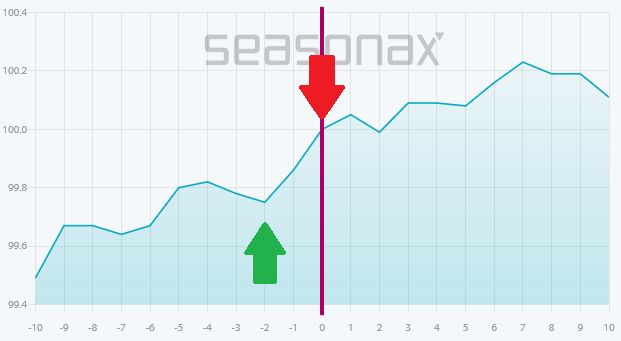
Mean trend of the gold price 10 trading days before and after the start of the month (1998 to 2023)
Gold rises particularly strongly in the two days before. Source: Seasonax
As you can see, gold rises particularly strongly at the turn of the month. Over these days, the annualized return has almost been 32 percent, while gold itself only gained less than eight percent on average.
You can now quickly analyze the “Turn of the Month” effect in Seasonax in detail by marking the two days as usual (see arrows). Since the line already represents the “1st Day of the Month”, it is the period from the close of the month to the second day of the following month (or the following trading day).
On the right you will then see the evaluation with important key figures, such as the annualized return or the hit rate (“winning trades”). Below you will find other diagrams and detailed statistics.
Now look at the capital yield curve (“cumulative profit”) here:
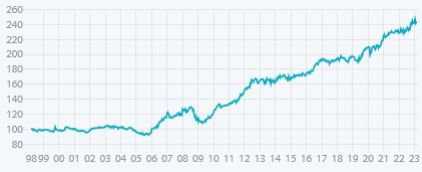
Gold: Capital Yield Curve of the “1st Day of the Month” Event
The event defied the gold bear market. Source: Seasonax
You can see that the effect has only been around since 2006. When evaluating, keep in mind that gold was in a bear market after 2011. Since mid-2020, the gold price has only run sideways, while the yield curve has risen.
Examine the “Turn of the Month” effect on your favorite instrument in seconds!
So the effect in gold is there, but it’s not strong.
There are stronger ones, for example the Indian stock index Nifty 50, which has had a very large “Turn of the Month” effect for 20 years.
But I don’t want to give too much away. After all, with just a few clicks of the mouse, you can now investigate the “Turn of the Month” effect in detail for yourself. This is not only for gold, but also for Stocks, indices, currencies and commodities – in other words, for over 20,000 instruments.
You can try it out right now at www.seasonax.com!
Warm regards,
Dimitri Speck
Founder and Chief Analyst of Seasonax
PS: Seasonax: Also use the many event studies!