
Dear Investor,
In commodities trading, seasonality is quite a popular tool – and rightly so! For example, agricultural commodities are often cheaper after the harvest than before the harvest. Natural gas that is difficult to store tends to be cheaper in the summer, as there is no heating in the Northern hemisphere.
However, in many commodities there are spreads between futures and spot markets that have to be considered in seasonal trades as well. In these commodities important seasonal effects are already priced into different delivery months. In these cases the seasonal pattern of the spot market differs from that of the futures market, which is usually relevant for market participants.
Easily recognizable seasonal effects are already priced in
Precisely because all market participants are aware of seasonal effects, futures contracts of e.g. natural gas expiring in summer delivery months are regularly trading at lower prices than contracts expiring in the winter months.
Consider in this context the following table, which shows the expiration dates and prices of natural gas contracts expiring between January 2021 and January 2022 as of 14 April 2020.
Natural gas, USD per British thermal unit, 14 April 2020
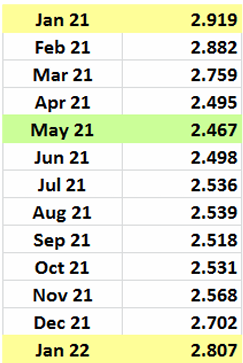
The May contract trades at the lowest price
Source: CME
As can be seen, the contract for delivery in January 2021 is the most expensive at USD 2.919. By contrast, the May contract is quite cheap at USD 2.467, thereafter prices increase again up to USD 2.807.
You might get the idea to buy May 2021 natural gas, take delivery and sell it again in January 2022. Careful: you will need a really big tank in your garden!
Pay attention to the futures curve!
In practice, many commodities can only be traded on futures markets. As noted, in certain commodities spot and futures prices as well as futures prices in different delivery months can strongly deviate from each other.
As is e.g. the case with natural gas, the reasons for this are partly high storage costs, but also non-availability (before harvests/production) or spoilage (of agricultural commodities).
This is the case in commodities such as natural gas, crude oil, wheat or corn. Thus you should make use of the seasonal patterns of futures prices rather than those of spot prices in these commodities.
The good news is: Seasonax offers the seasonal patterns of futures contracts for the most popular commodities as well!
Select the properly linked price chains of commodity futures!
Alas, this harbors yet another trap: futures contracts expire regularly. Data service providers then show the prices of the next nearest contract. However, there are different mathematical methods used in implementing this “rollover” into the next contract month to create long term charts. Sometimes the prices of the near expiration month are simply tacked on without changes, or the previous price pattern is adjusted by difference, or by proportion.
Only the latter method displays actual returns and permits the construction of a correct seasonal chart. The data provider of Seasonax and hence the Seasonax app itself offers different methods of splicing futures charts together.
In the search results you will find the correctly linked instrument at the top, grouped under the header “index” starting with the letters “BCOM” (Bloomberg single commodity excess return index) followed by the symbol for the commodity, such as “CL” for crude oil futures.
Thus, when entering “crude oil” into the search box, best select the instrument starting with the letters “BCOM” at the top of the list:
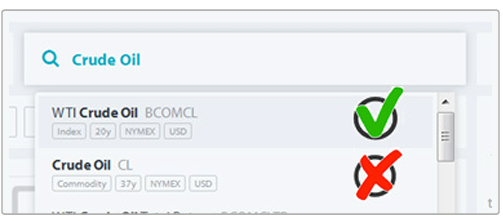
The selection menu of the Seasonax app already contains the properly linked instruments suitable for seasonal charts.
The proper selection further improves your results!
The differences in seasonal charts are often small, but occasionally they can be quite pronounced, particularly around rollover dates. The next chart illustrates the difference in the case of crude oil over a time period of ten years. At the top the optimal selection for seasonal analysis is shown, at the bottom the sub-optimal one.
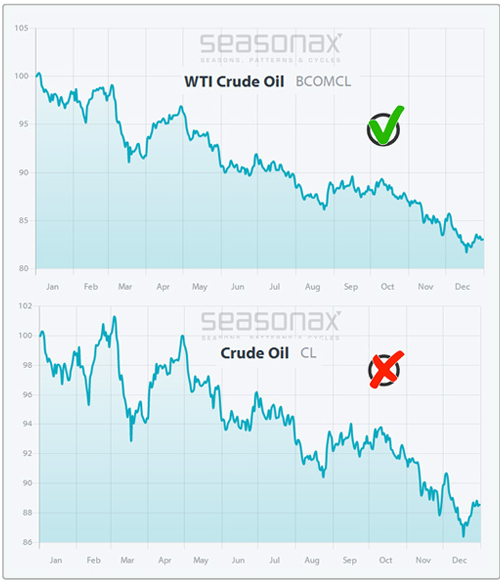
As this shows, the seasonal tendencies are comparable, but there are also differences. For example, the seasonal strength in February in the chart at the bottom stands out. It does not exist to this extent in reality, but is solely an artifact of the mathematical method employed. You should therefore use the chart at the top for analysis purposes!
Take advantage of seasonality in commodities trading!
Seasonality is one of the input factors that can improve trading results in commodities substantially.
Seasonax offers access to precise seasonal trends in commodity markets, just as in all other asset classes.
Thus for the best possible results, use the charts beginning with the designation “BCOM”.
There are a few exceptions to the issue discussed above, such as gold and silver. In these commodities the relationship between spot and futures prices is usually very tight, as they cannot spoil and storage is cheap. In these cases one can therefore use the instruments grouped under the header “commodity”. The advantage is that longer price histories are available.
I also recommend this article about seasonal patterns in commodities!
Yours sincerely,
Dimitri Speck
Founder and head analyst of Seasonax