
Dear Investor,
With Valentine’s Day approaching, I have decided to dedicate my latest research to love and the stock market. Are these two concepts more similar than we ever imagined and is there any correlation among them? Love is hard to define, but I can always rely on statistics. Researching the topic I came across an interesting study that was published by a team of relationship experts in Germany.
The Study
Obviously breakups occur throughout the year. However, there are two noteworthy time periods that are characterized by breakup rates skyrocketing. From November until two weeks before the Christmas holidays the number of couples deciding to separate increases at a particularly rapid pace.
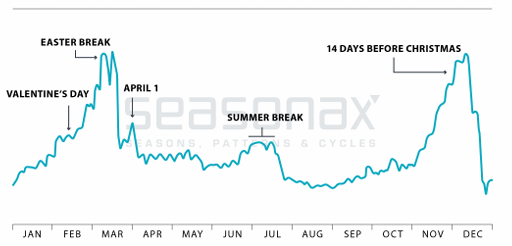
On the other hand, during the Christmas holidays themselves, the frequency of separations decreases for a short time. The second peak in breakups occurs in the spring, and they once again start increasing rapidly from February onward. Among the reasons for this are behavior patterns triggered by people’s New Year’s resolutions. Another important reason is the approach of warmer and sunny weather, which provides a boost to confidence and vitality. People are more optimistic and believe that finding new partners will be easy.
Should one invest in the stocks of dating services?
With that in mind, I would like to analyze the correlation between the stocks of dating service providers and the data presented above.
Momo (NASDAQ:MOMO), also known as “Tinder of China”, is one of the top online dating platforms. It started out as a social networking app, but gradually evolved into a platform for online dating and Live videos.
The stock of Momo enters a strong seasonal period from February until April, in the same time period when the break-up rate rises to one of its annual peaks. Let us take a closer look at the statistics.
Seasonal Chart of Momo Inc over the past 6 years
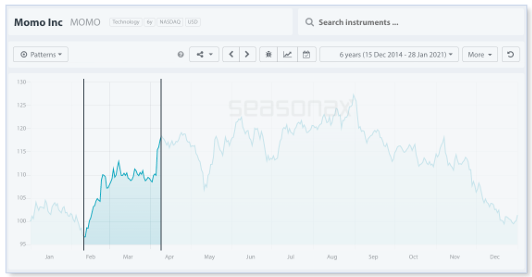
Source: Seasonax – by clicking on the chart image you can highlight the above mentioned time period on the chart and take a closer look at a detailed statistical analysis of the pattern
Please bear in mind, unlike a standard price chart that simply shows stock prices over a specific time period, a seasonal chart depicts the average price pattern of a stock in the course of a calendar year, calculated over several years. The horizontal axis depicts the time of the year, while the vertical axis shows the level of the seasonal pattern (indexed to 100).
I have highlighted the strong seasonal phase from February 10 to April 9 calculated over the past 6 years. In this time span of 41 trading days, the shares of Momo Inc rose on average by 27.05 percent. Furthermore, the frequency of positive returns generated over time during this phase indicates that this seasonal pattern is consistent and highly reliable.
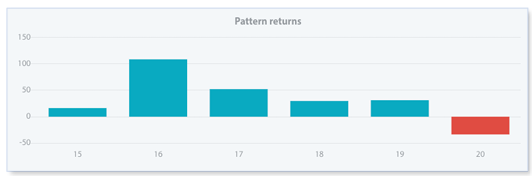
The bar chart below depicts the return delivered by Momo Inc in the relevant time period from February 10 to April 9 in every year since 2015. Blue bars indicate years with positive returns. Please note that by using the filter function you can filter out outliers. For example, a rare event such as the corona crash which bottomed out in mid-March 2020 can make a seasonal pattern look worse than it actually is.
Pattern return for every year since 2015
Source: Seasonax – Please click on the interactive chart to conduct further analysis
Another example of the largest publicly traded dating app companies is Match Group, Inc. (Nasdaq: MTCH). Match operates several popular dating platforms including Tinder, Match.com, OkCupid, and PlentyOfFish.
Last year’s lockdown had a positive impact on the stock price, as it spurred an unprecedented increase in demand. The stock has regularly shown stable returns in the second and third quarters of the past 5 years. Will the trend continue this year as well?
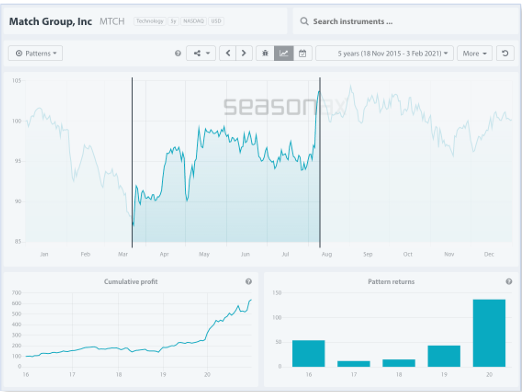
Source: Seasonax – with the help of seasonal patterns entry and exit dates can be optimized.
A question that suggests itself is whether people are perhaps trying to spice up their relationships by making use of such services… I will let you decide.
Future trends
Similar to what I pointed out in previous articles in the context of the gaming industry and tele-health companies, new technologies will play a crucial role in the future growth of online dating services.
The online dating business has reached an entirely new level thanks to Covid-19 and video-chatting has set new standards during the pandemic. It will be interesting to see which new technologies these companies will embrace going forward.
Just as in relationships, one thing is definitely certain in the stock market – past performance is not a guarantee of future results!
Enter the world of seasonal opportunities
Apart from the stocks I have presented in this issue of Seasonal Insights, there are numerous other stocks that display recurring seasonal patterns.
To make finding these opportunities even easier, we have launched a Seasonality Screener.
The Seasonality Screener is a tool designed to identify trading opportunities with above-average profit potential based on predictable seasonal patterns that recur almost every calendar year. The Screener is an integral part of your Seasonax subscription and calculates seasonal patterns for profitable trades starting from a specific date. Find the most profitable trades with just 2 mouse clicks TODAY!
Yours sincerely,
Tea Muratovic
Co-Founder and Managing Partner of Seasonax