There are a number of horror stories accompanying the markets these days: surging inflation, slowing growth and spiking energy prices. Nevertheless, there is yet one more spine-tingling event coming up on October 31: Halloween! However, we are going to consider how you can use seasonality and statistical probability and pattern recurrence to strengthen your trading in light of Halloween.
The promising news is, that while there is something particularly spooky about this day, it actually marks the start of a period that tends to yield promising returns for investors.
According to the National Retail Federation, total Halloween spending, encompassing the costs of candy, costumes, decorations and greeting cards, is projected to reach $10.14 billion this year.
Besides short upcoming trends in the stocks of some popular candy retailers, costume sellers and movies (see Netflix) around Halloween, there is also a long lasting trend making its way in the coming weeks, the so-called “Halloween Effect”.
The Halloween Effect
It originated in the City of London in the late 16th century, and has been passed from trader to trader ever since. This widely discussed phenomenon has gone beyond the interest of seasonal experts, and has been discussed by numerous scholars, including Jacobsen & Visaltanachoti; Haggard & Witte; Maberly & Pierce; and many others. It does indeed have evidence worthy of consideration.
The Halloween Effect defines the tendency of the market to perform better from Nov. 1 to April 30 than it does over the other months.
In search of proof I have analysed a seasonal chart of the S&P 500 Index. It can be easily seen that over the past 25 years there is a strong seasonal tendency from October 26 to April 30.
Keep in mind that the seasonal chart shows the average price pattern of the stock calculated over recent years. The horizontal axis shows the time of the year, and the vertical axis shows the percentage changes in the value of the stock, or in our case indices (indexed to 100).
Seasonal pattern of S&P 500 over the past 25 years
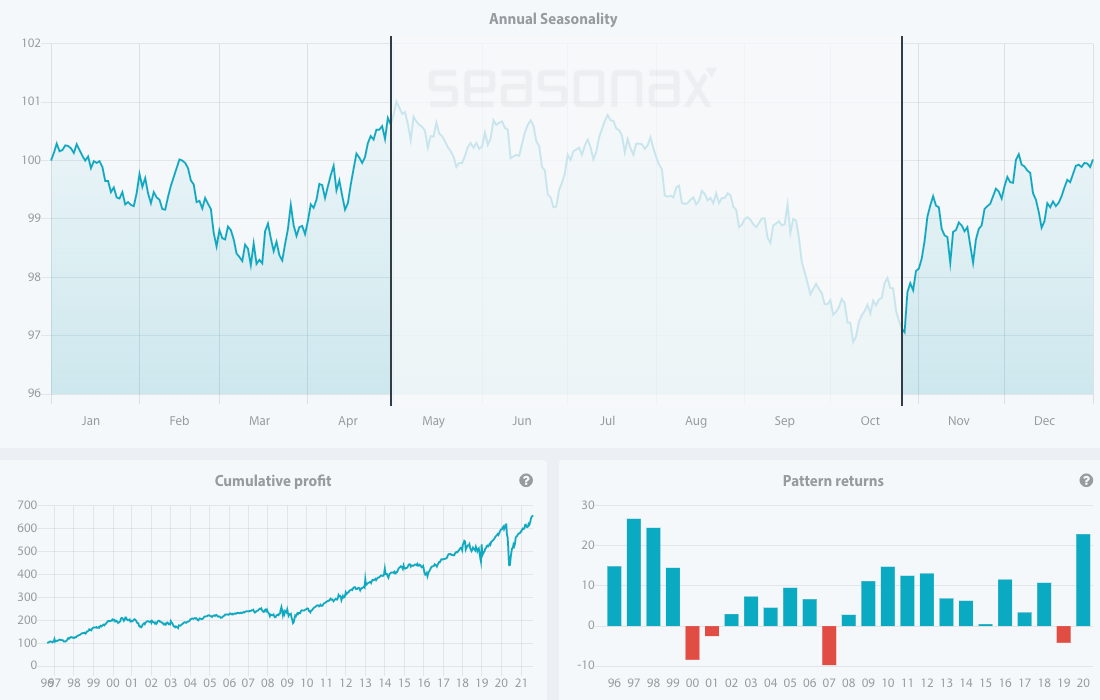
Source: Seasonax – by clicking on the chart you will be able to analyse different time periods in the chart
What Causes the Halloween Effect?
The retail sector, with the upcoming holiday shopping season, is one of the drivers of the surge in stocks in coming months. Halloween is just one of the sales events that unleash additional spending. Next in line is Black Friday, which is also set to contribute to driving stock prices up, as well as the traditional year-end stock rally and investor sentiment during the festive season.
Retailers and the entertainment industry will surge high in demand in the upcoming months. With this is mind, let’s look at the seasonal chart of Caesars Entertainment Corporation, which engages in the provision of casino-entertainment and hospitality services. Its brands include Aesars, Harrahs, Horseshoe, Wsop, Linq, Caesars and Paris.
From the chart, I can conclude that over the past 10 years, it has entered into a strong seasonal period from October 28 to December 30. In this time span of 43 trading days, shares rose by astonishing 20.97% on average.
Seasonal pattern of Caesars Entertainment Corporation over the past 10 years
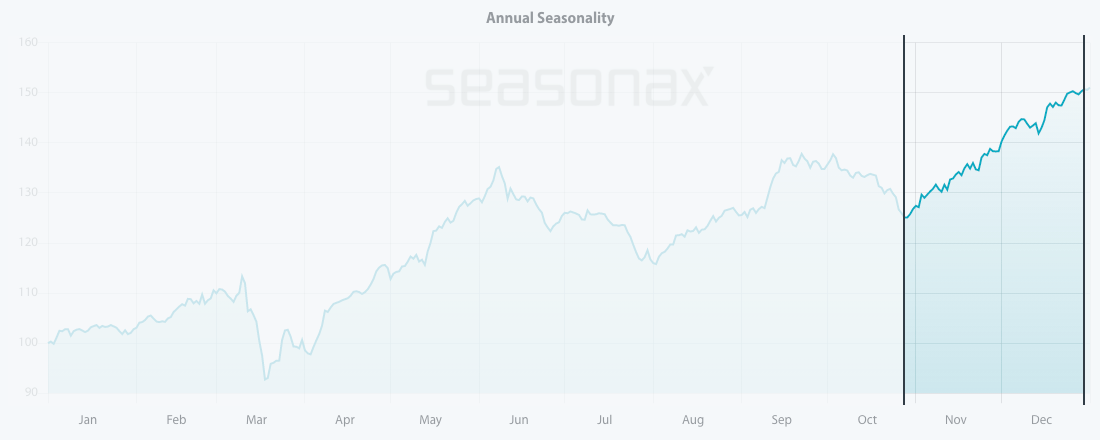
Source: Seasonax – by clicking on the chart you can conduct further analysis.
Moreover, the pattern returns in that period have been consistent and positive since 2011, with just one outlier year in 2014, when the stock posted an insignificant loss of 0.01 percent during the period under review.
Pattern return for every year since 2011
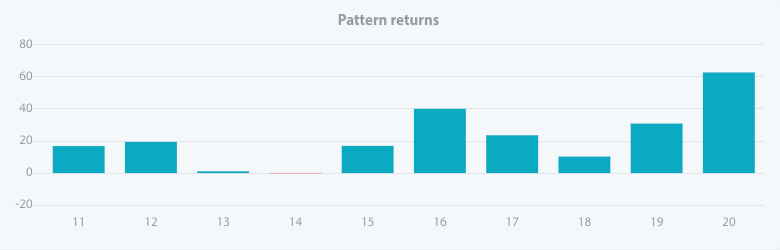
Source: Seasonax – click on the chart to conduct further analysis
Whether the trend will continue in 2021 cannot be predicted with certainty, but seasonality allows us to determine the probability of certain price moves. As a trading strategy, it is one of just a few approaches that are statistically verifiable. Since the calendar-based drivers underlying seasonal trends are independent of other driving factors, seasonality consistently creates added value for investors from a statistical perspective. In other words, you can incorporate seasonality and this use of statistical probability and pattern recurrence into the trading approaches you have employed so far. Maybe Halloween can be more treat than trick!
Enter the world of seasonal opportunities
There are many more stocks that are entering into their short or long strong seasonal periods.
To make finding these opportunities even easier, we have launched a Seasonality Screener. The screener is an analytical tool designed to identify trading opportunities with above-average profit potential starting from a specific date. The algorithms behind the screener are based on predictable seasonal patterns that recur almost every calendar year.
Feel free to analyze more than 25.000+ instruments including stocks, (crypto)currencies, commodities, indexes by signing up for a free trial.
Yours sincerely,
Tea Muratovic
Co-Founder and Managing Partner of Seasonax