
- Instrument: Silver (XAG/USD)
- Timeframe: June 30 – September 1
- Average Pattern Move: +5.43%
- Winning Percentage: 60.00%
Dear Investor,
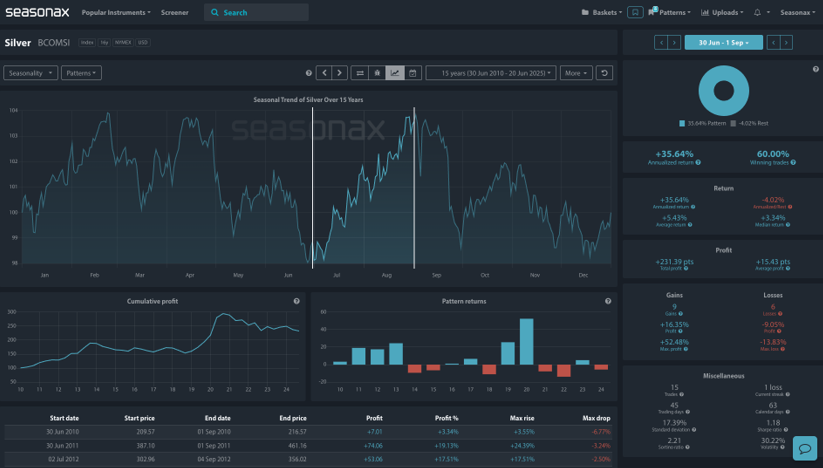
You may not realize that silver tends to shine brightest in the hot days of summer. Over the past 15 years, XAG/USD has posted a consistent seasonal pattern of strength from June 30 to September 1, with an annualized return of +35.64% and an average return of +5.43% during this window.
While silver is often overlooked in favour of flashier trades, the seasonal trend here is hard to ignore — especially when layered with recent bullish developments on the technical front.
Seasonal Sweet Spot: July-August Momentum
The Seasonax pattern highlights a clearly defined uptrend for silver starting at the end of June. Out of the last 15 years:
- 9 out of 15 trades ended profitably
- Max gain: +52.48%
- Median return: +3.34%
- Sharpe ratio: 1.18 | Sortino ratio: 2.21
The pattern also benefits from a favorable risk/reward profile. Even in years where losses occurred, the average downside was limited compared to the upside spikes, with volatility around 30%.
This kind of edge tends to align with periods of renewed inflation hedging, summer commodity rotation, and geopolitical tailwinds that often resurface in Q3.
Technical Perspective: Bollinger Band Breakout + Strong Support
From a technical perspective, silver is flashing bullish signals on the weekly timeframe:
- Price has cleanly broken above the upper Bollinger Band for the second time in recent weeks — a classic sign of trend continuation.
- The prior bullish piercing line pattern from early May marked a key reversal zone, providing strong support just below $30.
- Currently, the $35.00 zone represents a key pivot for buyers. This level acted as prior resistance and now sits near both the Bollinger midline and weekly demand cluster. A clean retest of $35 could offer attractive risk-reward entries for swing traders looking to participate in the seasonal move.
- OBV (On Balance Volume) remains elevated, suggesting strong underlying accumulation.
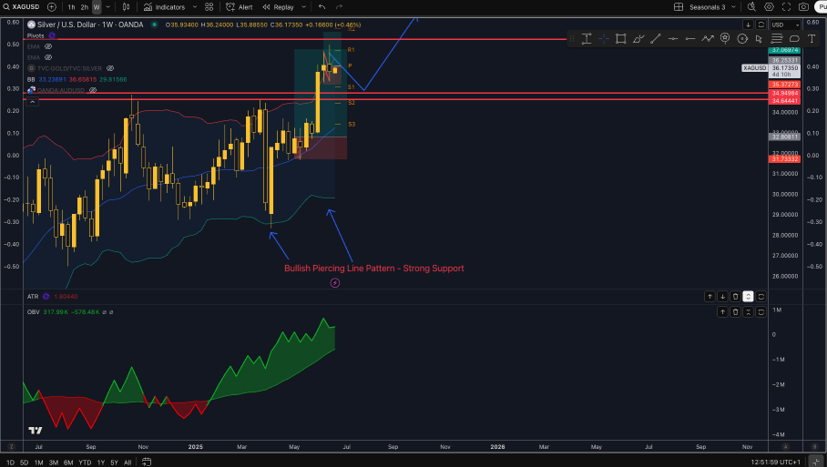
Should momentum continue, the chart structure allows for a test toward the $37–$38 range, aligning with the R2 weekly pivot zone.
Use Seasonax for your professional handling of market-moving events! Try it for 30 days for free! Sign up now
Trade Risks:
A breakdown below $34.00 would weaken the bullish structure and place the seasonal pattern at risk. As always, monitor macro catalysts including U.S. inflation data, central bank communication, and geopolitical headlines that could distort the technical and seasonal outlook.
Don’t just trade it, Seasonax it.