
- Instrument: S&P 500 Index
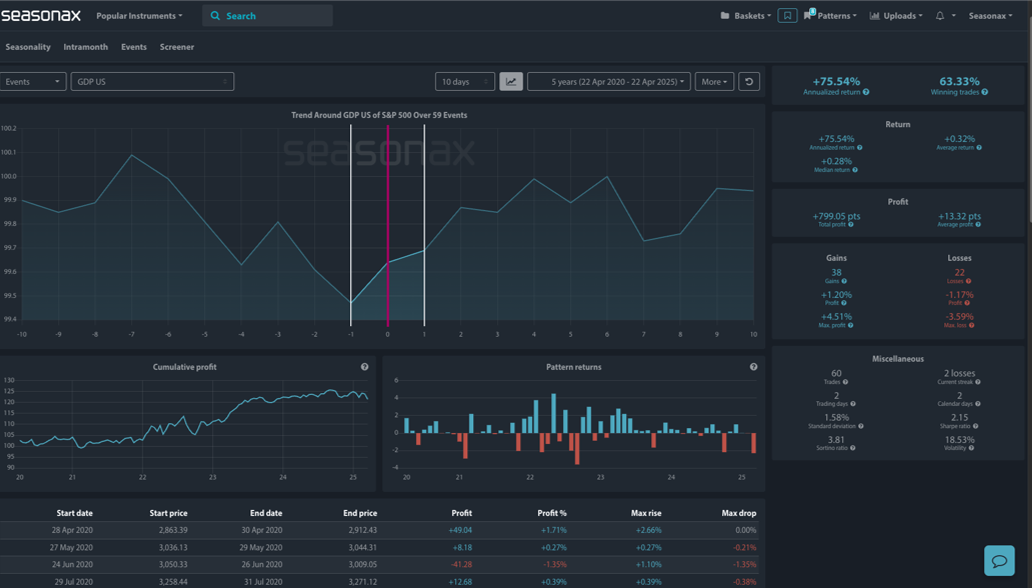
- Average Pattern Move: +0.28%
- Timeframe: 10 days around US GDP release
- Winning Percentage: 63.33%
Dear Investor,
You may not realize it, but despite mounting macroeconomic headwinds, the S&P 500 tends to perform well around US GDP releases. The IMF just slashed its 2025 US growth forecast to 1.8%, down from 2.7% in its previous update. Global growth was also cut to 2.8% for 2025 (from 3.3%), and while the IMF isn’t yet forecasting a US recession, it warned the risk has risen to 40%.
This matters. As the world’s most influential economy slows, investors are watching key macro indicators like GDP with heightened sensitivity. That’s why we want to analyze the data in more detail ahead of the US GDP release on Wednesday April 30.
The chart below shows you the typical development of the S&P 500 around the release of US GDP data over the past five years. Despite recent economic downgrades, the pattern has historically been resilient: the index delivered an average gain of +0.28% over a 2-day window on the GDP day and the day after, with a 63.33% win rate and an annualized return of +75.54%.
While the forward outlook may be clouded, seasonal forces continue to favour risk-taking into the data release. As the Fed becomes more data-dependent and the fiscal outlook evolves under the Trump administration, markets are still digesting how the current market dynamics will impact US growth.
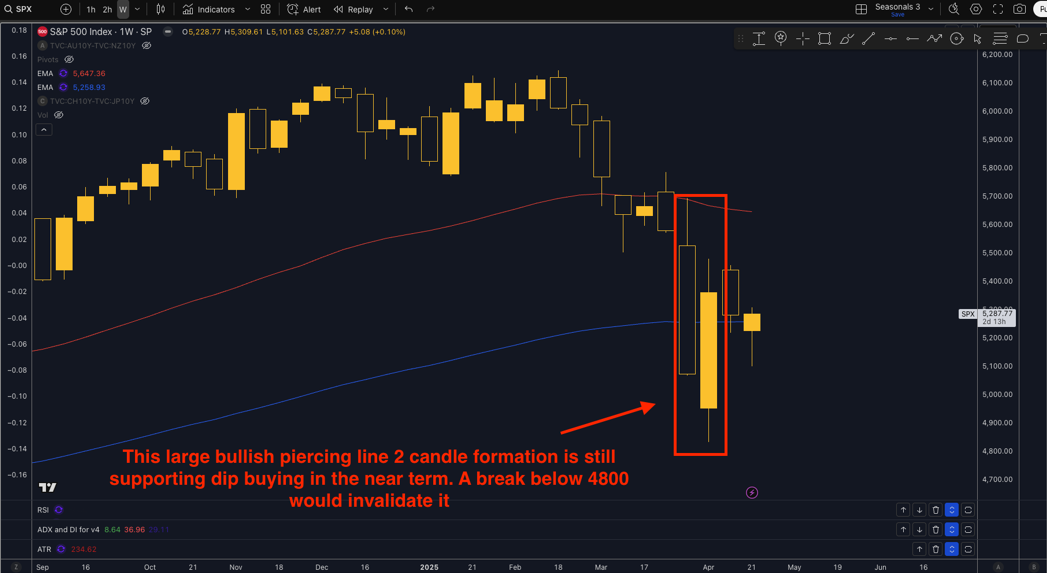
Technical Perspective
The bullish piercing line pattern on the SPX weekly chart—a two-candle reversal formation—signals potential short-term support after heavy selling. The first candle shows strong downside momentum, while the second opens lower but closes deep into the previous body, indicating aggressive dip buying. This structure, highlighted in red, remains valid while the index stays above 4800; a break below would invalidate the bullish bias and suggest sellers have regained control.
Use Seasonax for your professional handling of market-moving events!
Sign up here for thousands more seasonal insights waiting to be revealed!
Trade Risks:
The strong seasonal trend around US GDP prints may struggle to assert itself if upcoming macro data confirms the slowdown flagged by the IMF. Equity gains remain vulnerable to sticky inflation, earnings downgrades, and Fed hesitation. With the 10-year Treasury yield rising and global growth expectations rolling over, the S&P 500 could still face downside if the data disappoints.
Don’t Just Trade It – Seasonax It!