Dear Investor,
Eight times every year, the Federal Open Market Committee (FOMC) of the Federal Reserve holds its regular monetary policy meeting. Market participants are awaiting the outcome of this meeting with bated breath, as it determines the monetary policy of the most influential central bank: will it cut interest rates or hike them? These decisions can set the course for the world’s largest economy.
However, while most investors and analysts are focusing on the outcome of the FOMC meeting, from a statistical perspective it is actually the time leading up to the meeting that is of importance for investors.
The FOMC meeting triggers rallies!
But how exactly does the FOMC meeting impact the markets? In order to answer this question we will first examine its effect on the S&P 500 Index. To this end we take a look at the typical pattern of share prices before and after the second day of the Fed meeting, when the committee’s decisions are announced.
The chart below shows the average performance of the S&P 500 Index in the 10 trading days before and after the second day of the FOMC meeting. The chart was calculated over the past 15 years, during which 120 regular FOMC meetings have been held in total. The horizontal scale shows the number of days before and after the second day of the FOMC meeting, the vertical scale the average move in percentage points. The vertical orange line marks the day of the announcement.
Thus it can be seen at a glance on the seasonal chart what the pattern of US stock prices typically looks like in the days surrounding the Fed’s monetary policy meeting.
Average performance of the S&P 500 Index in the 10 trading days before and after the second day of the FOMC meeting (2006 to 2021)
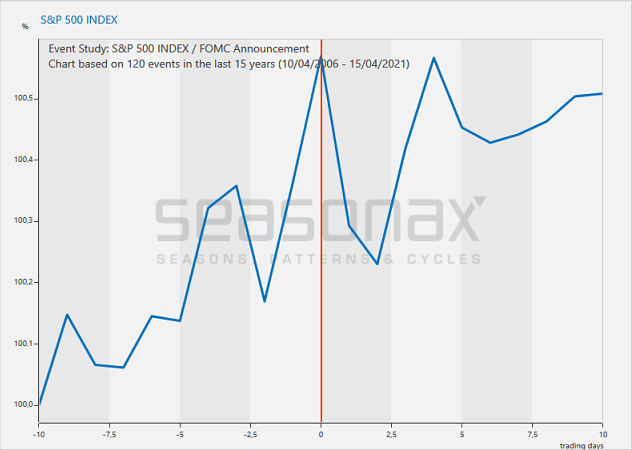
In the two days leading up to the meeting, the S&P tends to rise particularly strongly.
Source: Seasonax
As the chart reveals, share prices are already rising well before the outcome of the Fed meeting is announced. The average increase over seven trading days was 0.51 percent, with the bulk of the advance taking place in the last two days before the announcement.
However, in the days after the FOMC meeting, prices begin to move sideways – the high expectations of investors were not justified, at least in relation to the post-announcement trend!
Possibly you have already heard about the typical pattern of stock prices around FOMC meetings via an award-winning study by David O. Lucca and Emanuel Moench, at the time economists with the New York Fed.
However, it is not as widely known whether other major markets also exhibit typical patterns around Fed meetings. What is the relationship between FOMC meetings and prices in these other markets?
The FED meeting impacts currencies significantly as well!
EUR-USD is the most important currency pair. Take a look at the next chart in this context. It depicts the typical price moves of the euro against the US dollar around the Fed meeting. This time I have chosen a time span of 15 days before and 15 days after the FOMC meeting for a suitable illustration of the pattern associated with the EUR-USD pair.
Average EUR-USD pattern 15 trading days before and after the second day of the FOMC meeting (2006 to 2021)
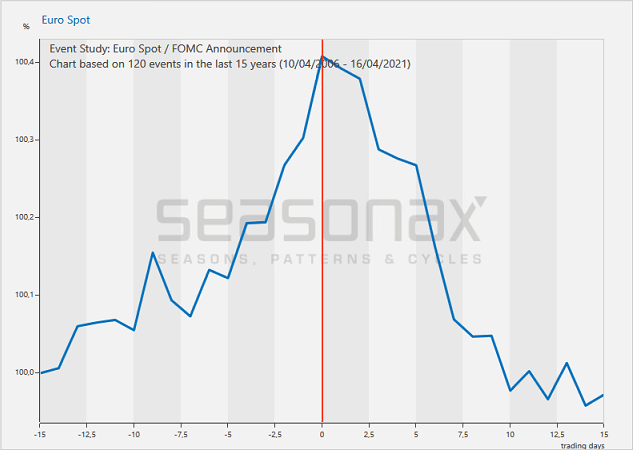
The euro appreciates ahead of the meeting and declines thereafter!
Source: Seasonax
It can be discerned quite clearly how pronounced the pattern of EUR-USD around the Fed meeting is – in the run-up to the meeting, the euro appreciates significantly. Particularly on the tenth day and then starting from the seventh day before the meeting a steep ascent is evident.
Thereafter a decline sets in that is just as swift. By the tenth trading day after FOMC meeting the euro has relinquished its entire gain against the US dollar again.
The trend reversal in EUR-USD coincides precisely with the second day of the FOMC meeting. The relationship between the Fed meeting and the euro/dollar exchange rate is obvious. It is even more pronounced than the more widely known relationship between the FOMC meeting and the pattern of the S&P 500 Index.
There are thousands of unknown patterns
As you can see, there are regular occurrences in the markets waiting to be discovered. Apart from events such as the Fed meeting, seasonality in particular provides countless recurring patterns for all kinds of different markets. From stocks to indexes, commodities, currencies and even bonds, every market has something to offer. You are most welcome to have a look for yourself!
Yours sincerely,
Dimitri Speck
Founder and Head Analyst of Seasonax
PS: The FOMC meeting provides a tailwind to stocks and currencies in advance!