Dear Investor,
You may have noticed: While the economy is growing in most countries, it is shrinking in Germany. High energy prices, rampant bureaucracy and confused politics are causing entrepreneurs in this once proud country to despair.
In this environment, many investors are turning their attention to economic indicators. One of the most important for Germany is the ZEW Index. More than 350 institutional investors are surveyed for their assessment of the economy. The ZEW Index is published monthly around the middle of the month.
The ZEW index provides a good example of how the publication of economic data influences share prices.
The German stock market turns on the publication of the ZEW index
The event chart below shows you the average performance of the German share index DAX in the five trading days before and after the publication date of the ZEW index, over the past 23 years. The red line in the middle marks the publication day.
Average performance of the DAX 5 trading days before and after the publication of the ZEW index
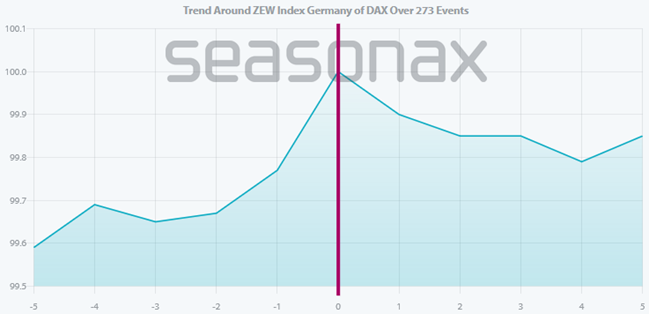
The DAX rises in the days before the ZEW publication. Source: Seasonax
As you can see here, German share prices rose in the run-up to the release of the ZEW index.
After that, they tend to fall.
What is particularly striking is that the DAX turns around exactly on the day the ZEW index is published. This is an indication that it is indeed the economic index that is influencing prices.
The ZEW index has a lasting impact on German share prices
Can a trader take advantage of this pattern? Take a look at the capital yield curve for the two days leading up to the ZEW publication date:
Capital yield curve of the event “two days to the ZEW publication”
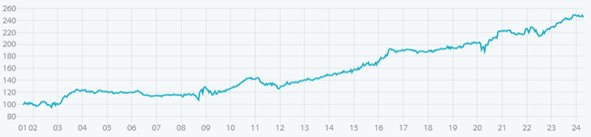
An increasing yield curve Source: Seasonax
As you can see, the DAX rose quite steadily from around 2010 in the two days leading up to the publication of the ZEW index. Since then, a trade would have been quite profitable.
How did things look after the publication date of the economic index? Take a look at the capital yield curve in the four days following the publication date of the ZEW Index:
Capital yield curve of the event “four days after ZEW publication”
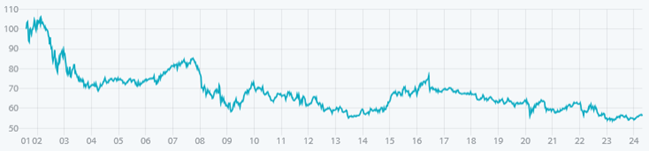
The prices fell. Source: Seasonax
You can see the weakness in share prices in the four days following the publication of the ZEW index.
Bear in mind that the DAX more than tripled from 2008 onwards, and that prices fell overall during these four days. It would have been wrong to go long in those four days.
How to use the ZEW event as a trader and investor
However, you cannot only trade this pattern directly as a trader.
Alternatively, you can also use it as a filter: It is better not to go short in the days before the ZEW publication date, and not to go long in the days after.
If you have a longer-term view, you can use it to optimize your exit timing: It is best to sell German shares on the day the ZEW index is published.
You can check your favorite instrument for events yourself!
The influence of the ZEW index on German share prices is just one example.
With the Seasonax event tool, you can analyze the influence on prices for many regular events, such as: the publication of economic data, public holidays, the expiry of futures, or central bank meetings themselves.
You can combine all events with all instruments – indices, individual shares, currencies or commodities.
How: Call up the instrument like the S&P 500. You will then find the event button on the left:
Screenshot, excerpt, from Seasonax
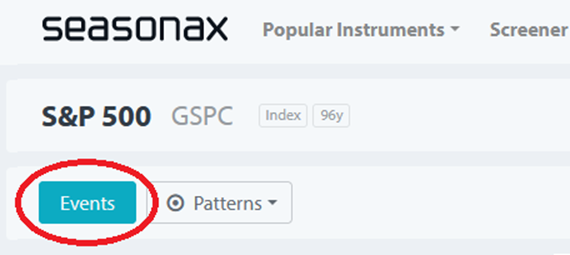
The events are easy to find. Source: Seasonax
You can then select the event that interests you personally, such as the ZEW Index, from the drop-down menu.
Let us inspire you!
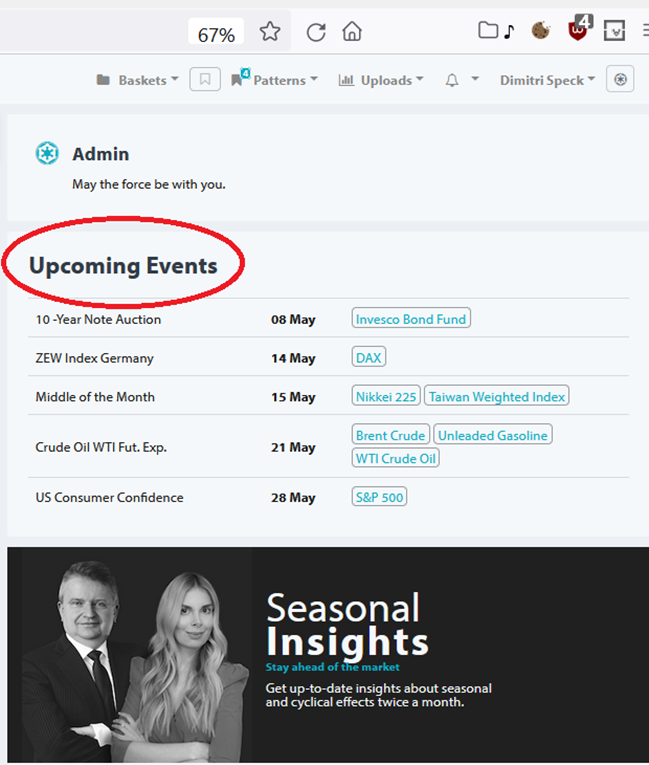
However, you are also welcome to take inspiration from our suggestions. These are updated on an ongoing basis. You will only be shown the suggestions that could influence prices in the coming days.
The suggestions are displayed immediately when you log in to the Seasonax app. In addition to the event, such as the ZEW index, you will also see one or more instruments, such as the DAX, on which the event has an effect.
Just click on the instrument and within seconds you will see how the instrument typically runs around the event.
Screenshot, excerpt, from Seasonax
The Seasonax app makes suggestions. Source: Seasonax
This saves you many hours of time – collecting the data yourself and analyzing it in Excel, for example.
You can improve your trades and your investments, and at the same time get ahead of other investors!
The event tool: another innovation from Seasonax
Use the Seasonax event tool, which is available to you in addition to Seasonax‘s popular seasonality functions!
As an investor, there is no quicker and easier way to investigate how events regularly affect prices.
Best regards,
Dimitri Speck
Founder and Chief Analyst of Seasonax
PS: Benefit from all the innovative features of Seasonax, from the seasonal analyses and the event studies!