Dear Investor,
The turn of the year, 2023 into 2024, is just around the corner. As an investor, you may well be wondering what the new year will be like.
In terms of politics, the US presidential elections are approaching. Although the new – or old – president will not be inaugurated until 2025, elections also influence share prices in their run up. This election cycle is in fact known as the four-year cycle.
Contrary to the expectations of many investors, statistically speaking it hardly matters for the stock markets whether a Republican or Democrat is elected. What matters is which year of the four-year election cycle we are in.
So take a look at what the typical election year looks like on the US stock market!
The 4-year cycle influences the markets
The phenomenon known as the 4-year election cycle differentiates according to the year of the presidency. In the 121 years between 1900 and 2020, the Dow Jones rose by an average of 5.89% if it was a presidential election year. In pre-election years, it performed even better at 9.03%. In post-election years, on the other hand, it rose by just 4.54%, and in the following mid-term election years by just 1.36%.
The 4-year election cycle in detail
But what does the development look like in detail? Take a look at the average four-year performance of the Dow Jones in the chart. This allows you to take a closer look at developments within the cycle. The scale on the right shows gains as a percentage. The scale at the bottom indicates the specific year of the four-year cycle.
Above “Election” the average course of all election years is shown; above “Post-Election” that of all post-election years; above “Midterm” that of all mid-term election years; and above “Pre-Election” that of all pre-election years.
The chart thus communicates the average trend over all four years.
Dow Jones, 4-year cycle, calculated over 121 years
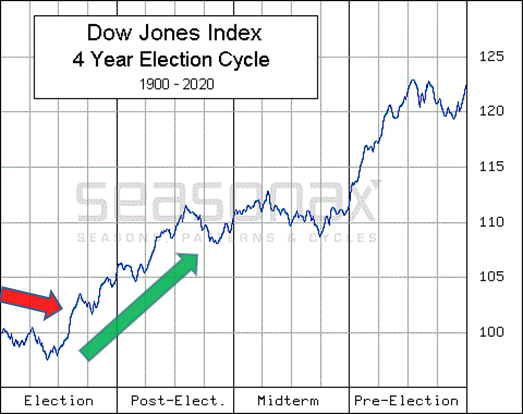
The election year gets off to a weak start. Source: Seasonax
Now pay attention to the left quarter of the chart. This shows the typical performance of the Dow Jones in election years.
As indicated by the red arrow, these typically posted losses in the first half of the year. After that, things look much better, as indicated by the green arrow.
2024 is now an election year. The election cycle suggests a weak first half of the year, and a good second half.
But, how can you analyse the election cycle yourself with Seasonax?
How to use the filter function on Seasonax
To do this, call up the filter function in Seasonax under “More” on the right above the chart.
There you can display the average course of the election years by selecting the “Election” filter.
Filter function
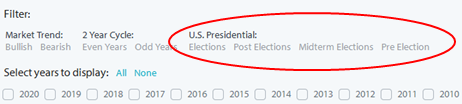
One click to the election cycle. Source: Seasonax
Then you can see the average performance of your favorite share, gold, or the euro, in the election year.
You can of course also look at other years in the four-year cycle, or use different filters such as even/odd years.
Seasonax supports you in a variety of ways with your investment!
As you can see, Seasonax not only allows you to view seasonal charts, but also events such as the election cycle.
Take advantage of this variety from wwww.seasonax.com!
Best regards,
Dimitri Speck
Founder and chief analyst of Seasonax
PS: With Seasonax you can carry out a variety of analyses to improve your investment results!