Dear Investor,
During Covid lockdowns many couples found their relationships under fire! However, amongst those who “survived” 24/7 surroundings, some became ready for the next big step in their lives together – the wedding.
Rates of weddings have not yet returned to their pre-pandemic levels, but according to the New York Times Wedding Report, next year they will jump to their highest level since the 1980s. Whilst socialising and events are beginning to make their return big style, weddings will soon follow suit.
Peak wedding season varies slightly from year to year, but typically late summer and early fall are the most popular times to get married. June, September and October are the months that are especially high in demand.
There is a lot more to weddings than the actual ceremony. The vendors, photographers, caterers are all side businesses that accompany the events and which are profiting the most. In today’s Seasonal Insights I will provide you with a couple of ideas as to how you yourself can profit from weddings without walking down the aisle!
When talking about weddings, the first thing that crosses my mind is the Indian wedding season and the fluctuation of gold prices around this event. An estimated two thirds of annual gold production is used in jewellery production. Gold demand for jewellery thus has a noticeable effect on prices.
Who is profiting the most
It is not only in India that jewellery never goes out of fashion, and a wedding without it would not be the same. This is a global trend.
Tiffany or Signet Jewelers Limited (a company that makes over $6.5 billion a year from jewellery sales) are prime examples of high class jewellery, perfect for weddings.
Looking at the seasonal chart of Signet Jewelers Limited I can conclude that over the past 10 years, it has entered into a strong seasonal period from September 22 to November 18. In this time span of 41 trading days, shares rose by 11.72% on average.
Keep in mind that the seasonal chart shows the average price pattern of the stock calculated over the past several years. The horizontal axis shows the time of the year and the vertical axis shows the percentage changes in the value of the stock (indexed to 100).
Seasonal pattern of Signet Jewelers over the past 10 years
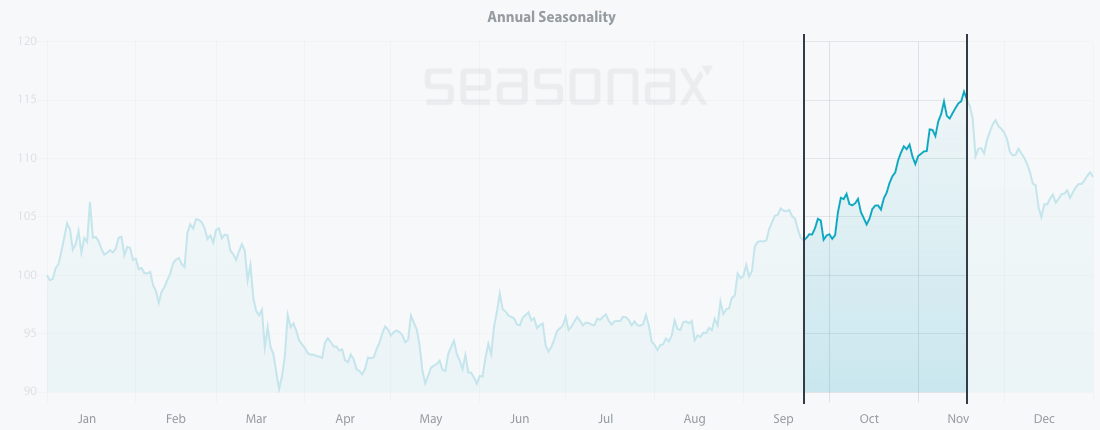
Source: Seasonax – by clicking on the chart you will be able to analyse different time periods in the chart
Moreover, the pattern returns in that period have been consistent and positive since 2011, with just one outlier year in 2018, when the stock posted a significant loss of 17.71 percent during the period under review.
Pattern return for every year since 2011
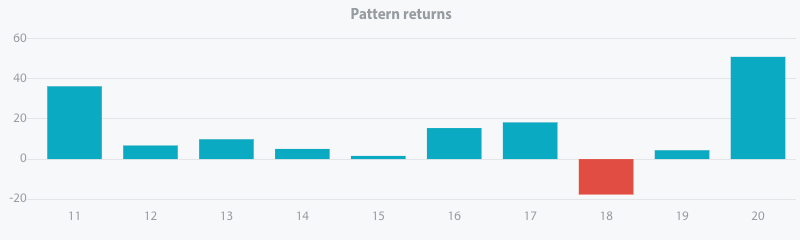
Source: Seasonax – click on the chart to conduct further analysis
Similar to popular jewellers, there are also other sectors that could be lucrative for you as an investor and have a positive correlation with the wedding industry.
For instance, think about all the unnecessary presents that end up stored away after the wedding. To avoid this issue in the States, 80% of the couples set up their own personalised registry. Kitchenware and linens are popular products that are included on one’s registry, and companies such as Williams-Sonoma, Macy’s or Bed Bath and Beyond are making a killing selling it.
Williams-Sonoma, Inc. is one of the biggest e-commerce retailers, specialising in kitchenwares and home furniture, with a distribution network of more than 60 countries. Wedding bells are definitely ringing at Williams-Sonoma registries with sales already doubled during the second quarter of the year.
To prepare for the 2022 wedding season you should definitely take into account the strong and weak seasonal period of this stock.
Seasonal pattern of Williams-Sonoma Inc. over the past 10 years
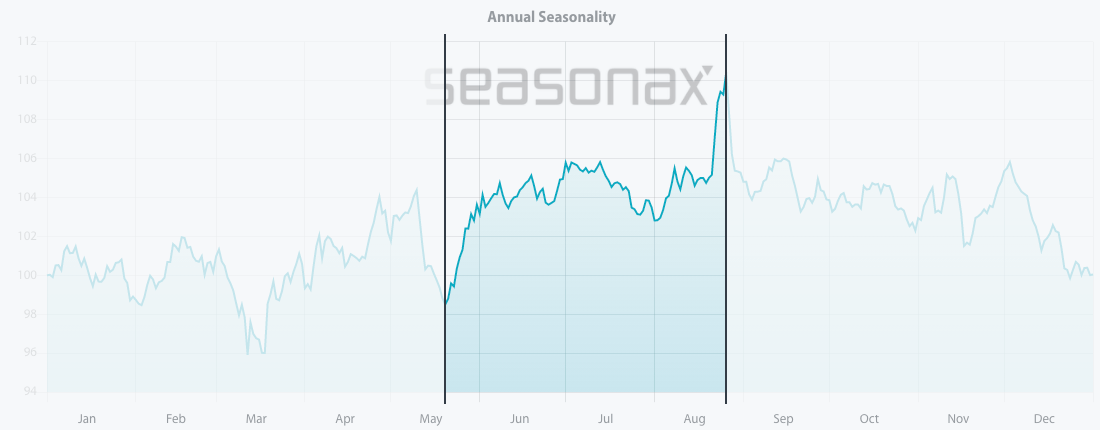
Source: Seasonax – by clicking on the chart you can conduct further analysis.
The 10-year seasonal chart of Williams-Sonoma Inc. shows a strong seasonal period from May until late August.
On average Williams-Sonoma Inc. has delivered solid returns of 17.67% during this time period over past 10 years, which corresponds to a very respectable annual gain of 83.41%.
Further analysis reveals the frequency of positive returns during this phase. The bar chart below depicts the return posted by Williams-Sonoma Inc.in the relevant time period from May 20 to August 26 in every year since 2012. Blue bars indicate years with positive returns and red bars indicate negative returns.
Pattern return for every year since 2012
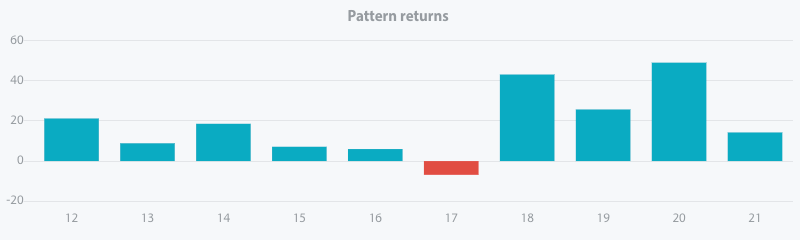
Source: Seasonax – click on the chart to conduct further analysis
The wedding industry is not only massive, it is also growing by the year. While this is maybe overwhelming for those planning a wedding, it is exciting for businesses that operate in and around the industry. It makes sense whether you decide to invest in your marriage, or in the stocks that are correlated to the industry, to be aware of the current market situation and the seasonality of individual stocks. Investors who understand the seasonality of their market can time their strategies in line with the expected seasonal effects.
Enter the world of seasonal opportunities
In addition to “marriage” stocks there are many more stocks that are entering into their strong seasonal period.
To make finding these opportunities even easier, we have launched a Seasonality Screener. The screener is an analytical tool designed to identify trading opportunities with above-average profit potential starting from a specific date. The algorithms behind the screener are based on predictable seasonal patterns that recur almost every calendar year.
Feel free to analyze more than 25.000+ instruments including stocks, (crypto)currencies, commodities, indexes by signing up for a free trial.
Yours sincerely,
Tea Muratovic
Co-Founder and Managing Partner of Seasonax