Dear Investor,
You have probably heard about the Halloween effect or the autumn rally. The former term refers to the fact that stocks on average tend to perform significantly worse in the summer months than in the winter months, the latter term describes the typically very strong advance in stocks before the turn of the year.
Both phenomena apply to the broad stock market, i.e., the benchmark indexes.
A number of individual stocks have their own “seasons”
However, certain individual stocks can diverge from the indexes and exhibit seasonal patterns of their own. I will illustrate this with an example.
Hasbro: seasonal strength from February to May
I have picked Hasbro, a manufacturer of toys headquartered in Pawtucket, Rhode Island in the US. You are very likely familiar with one of the company’s products: Monopoly (a board game originally made by Parker Bros.).
Take a look at the typical pattern the stock exhibits in the course of a calendar year, which can be discerned at a glance on a seasonal chart. The chart below is calculated by averaging the performance of the stock over the past 32 years. The horizontal axis depicts the time of the year, the vertical axis the level of the seasonal pattern (indexed to 100).
Hasbro, seasonal pattern over the past 32 years
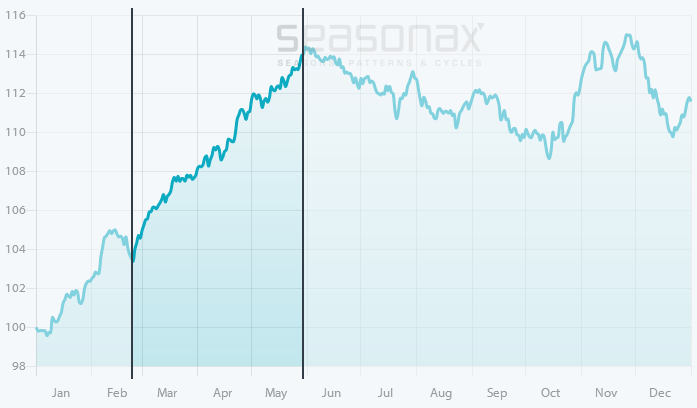
Hasbro typically advances strongly from February to April. Source: Seasonax
As the chart shows, Hasbro typically rallies very strongly in the months to the end of May.
A time period associated with a strong seasonal performance is highlighted on the chart. It begins on February 24 and ends on May 30.
Hasbro’s very positive performance at this time of the year diverges from that of benchmark indexes like the S&P 500. In seasonal terms, the latter typically barely rises until mid-March, while it usually displays significant strength at the end of the year.
How frequent were rallies in Hasbro during the seasonally strong period?
Hasbro rose in 16 of 20 cases
The bar chart below depicts the return delivered by Hasbro shares in the relevant time period from February 24 to May 30 in every year since 1988. Red bars indicate years in which negative returns were generated, blue bars indicate years with positive returns.
Hasbro, average return in percentage points from Feb. 24 to May 30, in every year since 1988
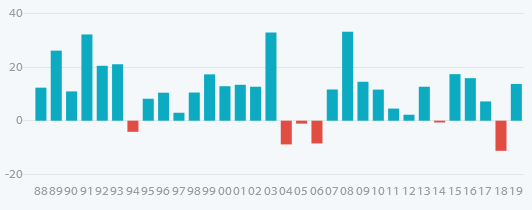
On just six occasions the stock posted relatively small losses. Source: Seasonax
As can be seen, the blue bars predominate both in terms of size and frequency. There were 26 rallies, while relatively small price declines were recorded in the remaining six years.
In short, the gains were widely distributed.
Take advantage of the strongest seasonal periods!
As you can see, individual shares often exhibit unique seasonal patterns. They can even rise when the broad market falls. As there are many listed stocks, it is possible to implement seasonal diversification. Furthermore, at any time in the course of a year there are individual stocks that stand out in terms of their seasonal performance. This means there are opportunities for investors throughout the year. On www.app.seasonax.com you can examine the seasonal patterns of countless individual shares.