Dear Investor,
Seasonality is not just driven by fundamentals: emotions and calendar seasons also have a significant influence on stock prices. Especially when the calendar changes from summer to fall, the mood of investors tends to change as well.
With respect to sharp stock market declines, the month of October has “earned” a bad reputation over the decades. The largest single day decline in history happened on “Black Monday” October 19 1987 and saw the Dow plummet 22.6%. Moreover, October has historically been the most volatile month. According to Macro Risk Advisors, the CBOE volatility index, a.k.a. the VIX, on average tends to jump to an annual peak of more than 21 points over the past 30 years during October.
In this issue of Seasonal Insights I will analyse the seasonal patterns of the S&P 500 Index and of one of the hottest stocks on the market, Tesla (TSLA).
Will Tesla Drive the Market in October?
Tesla does not need a special introduction. It is one of the stocks that receives undivided attention from the media and investors and is the subject of numerous interesting debates over its (over)valuation. The stock’s moves in the past few months have put a smile on the faces of many investors – provided they had a long position, that is.
The stock received an additional shot in the arm in the summer when the company announced a stock split.
But what exactly is a stock split? In a stock split a company divides its existing shares into multiple shares. Technically speaking, stock splits don’t change the value of a company, or the value of investors’ holdings. However, the strategy does reduce the price of individual shares, which can enhance a stock’s liquidity by making it more accessible to retail investors. And during the COVID -19 pandemic retail investors held enormous sway in the market, while large institutional investors took a back seat.
Since the beginning of this year Tesla’s stock price has quadrupled. There was a setback in September when the stock was not included in the S&P 500 Index due to its “shaky fundamentals”.
But what will the situation look like in the frequently crash-prone month of October?
To this end let us examine the seasonal chart of Tesla, which shows the seasonal pattern of the stock over the past 10 years.
Seasonal pattern of Tesla over the past 10 years
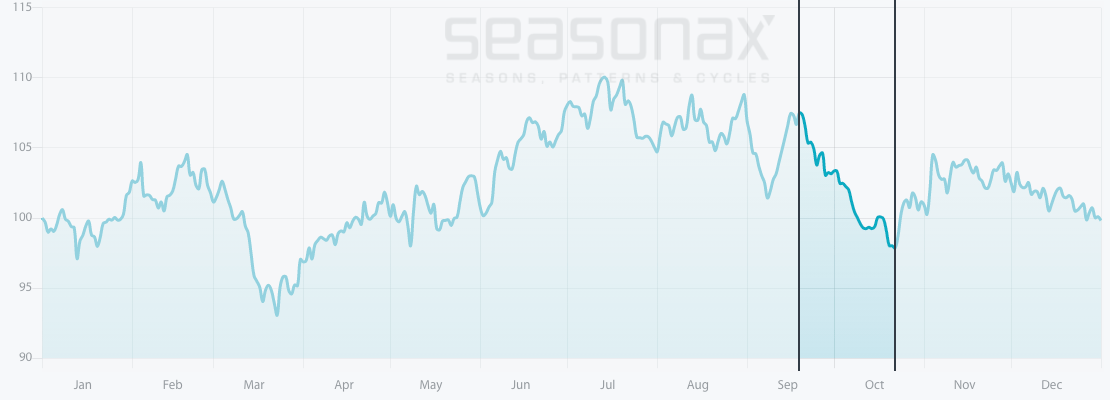
Tesla typically delivers weak seasonal returns during the month of October.
Source: Seasonax (click here to examine the best investment period for the selected stock
I have highlighted the weak seasonal phase from September 19 to October 22. On average Tesla has delivered a very poor annualized return of -49.47% during this period.
Even more important is the pronounced consistency of the negative returns generated during this phase, which suggests that this pattern is highly reliable.
The bar chart below depicts the return delivered by Tesla in the relevant time period from September 19 to October 22 in every year since 2010. Red bars indicate years with negative returns.
Pattern return for every single year since 2010
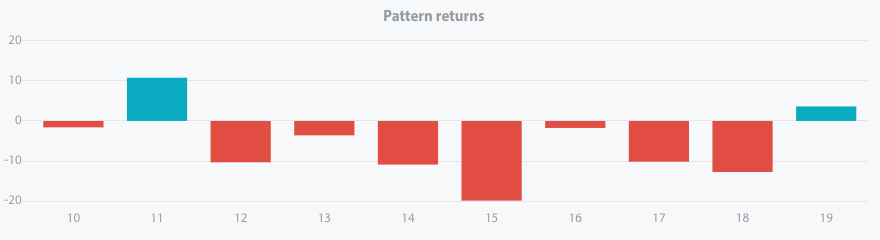
Whether this pattern will recur in 2020 it is hard to predict but our detailed statistical analysis will provide you with an additional edge in your investment process.
Is the “October Effect” Overrated?
To answer this question we have conducted a close examination of the seasonal patterns of the S&P 500 Index.
Please note, unlike a standard price chart that simply shows stock prices over a specific time period, a seasonal chart depicts the average price pattern of a stock (or index) in the course of a calendar year, calculated over several years. The horizontal axis depicts the time of the year, while the vertical axis shows the level of the seasonal pattern (indexed to 100). With that in mind, let us examine the seasonal chart of S&P 500 Index, which shows the seasonal pattern of the index over the past 35 years.
Seasonal pattern of the S&P 500 Index over the past 35 years
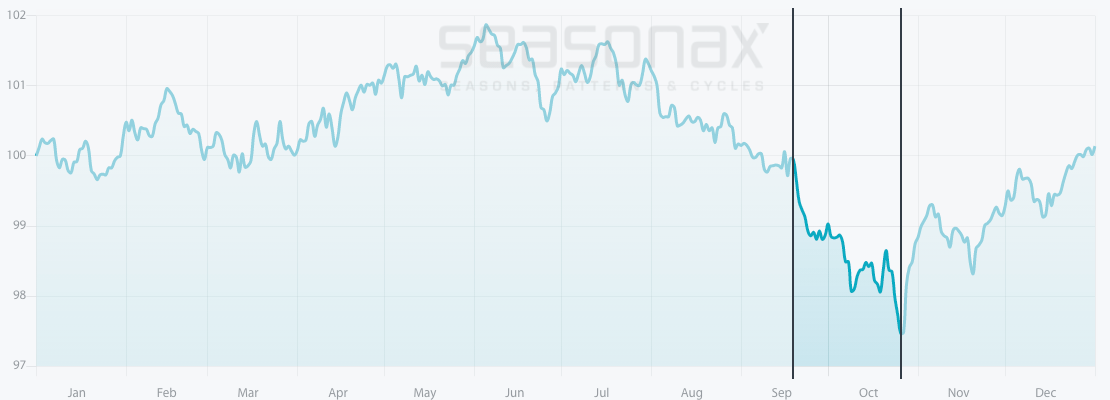
The S&P 500 Index typically delivers weak seasonal returns during October.
Source: Seasonax (click here to examine the examine the best investment period for the selected stock
I have highlighted the weak seasonal phase from September 19 to October 26. On average S&P 500 has delivered a negative annualized return of -16.24% during this period. In this period we can also detect two extremely severe price slumps, one of – 26.69% in the course of the 1987 crash and one of -32.36% in the course of the financial crisis of 2008.
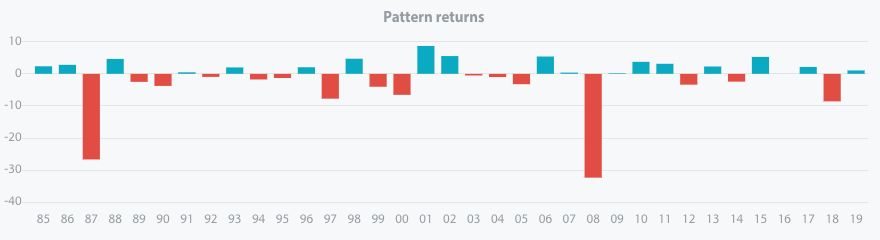
Pattern returns since 1985 do not look too appealing (blue bars indicate years with positive returns and red bars represent losses).
By removing the statistical outliers you can review an even more nuanced analysis with the help of our seasonal charts.
Enter the world of seasonal opportunities
Apart from the video game stocks we have presented in this issue of Seasonal Insights, there are numerous other stocks that display regularly recurring weak and strong seasonal periods.
To make finding these opportunities even easier, we have launched the new Seasonality Screener.
The Seasonality Screener is a tool designed to identify trading opportunities with above-average profit potential based on predictable seasonal patterns that recur almost every calendar year. The Screener is an integral part of your Seasonax subscription and calculates seasonal patterns for profitable trades starting from a specific date. Find the most profitable trades with just 2 mouse clicks TODAY!
Yours sincerely,
Tea Muratovic
Co-Founder and Managing Partner of Seasonax