Dear Investor,
You may be familiar with the four-year cycle, also known as the election cycle, which is characterized by the presidential elections that take place every four years.
Did you know that the election cycle also exists for other instruments such as gold?
Things are getting interesting right now. The current year, 2026, is a midterm election year. And gold performs very well in midterm election years: for gold, the midterm election year is the best year in the four-year cycle!
The four-year cycle in gold
Let’s look at the results of a gold investment in each year of the four-year cycle. The table shows the average performance of gold in election years, post-election years, midterm election years, and post-election years, in US dollar terms, starting in 1968.
| Four-year cycle: Gold performance since 1968 | |||
| Election year | Post-election year | Midterm election year | Post-election year |
| 3,94% | 5,28% | 11,09% | 9,68% |
You can clearly see that the years with midterm elections – such as 2026 – performed best with 11.09%. But the years following the general election – such as the upcoming 2027 – also fared well with 9.68%.
The midterm election year in detail
But what does a midterm election year look like in detail? After all, we’re already halfway through the year. Take a look at the chart. It shows you the seasonal trend of gold only in years that are midterm election years.
Gold, typical course of the midterm election years, 1968 to 2026
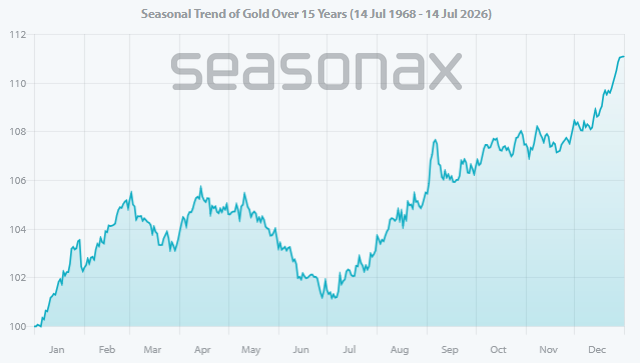
As you can see, in midterm election years, gold prices typically rise sharply starting in July. This increase, characteristic of midterm election years, lasts until February of the following year.
The situation for gold is therefore improving cyclically from now on. The weakness of the past few months could now be replaced by an upward movement!
Use the filter function!
As you can see, Seasonax offers you much more than just annual seasonality. Use Seasonax ‘s filter function if you want to see how an instrument performs over a four-year cycle or any other cycle. You’ll find the filter switch in the upper right corner of each seasonal chart.
Filter switch
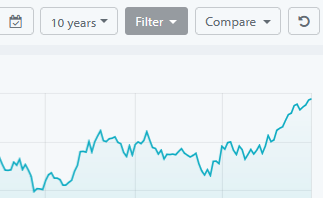
After clicking, the redesigned filter menu opens. With it, you can assess the cyclical market situation and apply all kinds of filters in just a few clicks.
Filter function on Seasonax , with selected election cycle
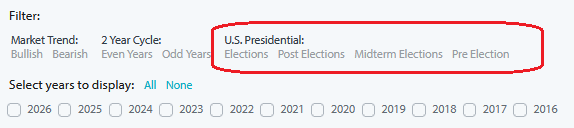
This allows you to instantly see the typical price movements of specific years, such as midterm election years, for all instruments, in addition to the annual seasonality, with just a few clicks. Alternatively, you can filter for individual years that exhibit particular characteristics. This way, you can further improve your trading results.
Try it out!
Warm regards,
Dimitri Speck
Founder and Chief Analyst of Seasonax
PS: In addition to the filter functions, Seasonax has redesigned its comparison functions!