Dear Investor,
Have you ever wondered why the media only starts covering the year-end rally once the biggest gains are long gone? Experts and self-proclaimed specialists regularly appear on TV shows in early December to share their opinions on the year’s final few trading days.
But if you look at the statistics—which is incredibly easy to do with Seasonax—you’ll see that the year-end rally is, for the most part, already over.
In this Seasonal Insights, we’d like to introduce you to some very typical market trends from which you can benefit immediately.
Maybe the year-end rally will already start when the first gingerbread cookies hit the shelves
Recently, there were reports that the first Christmas gingerbread cookies had already appeared on store shelves—and that was in early September. You can, of course, enjoy this sweet treat all year round, even if its health benefits certainly leave something to be desired. A look at the DAX’s seasonal chart shows that the so-called year-end rally typically begins as early as the end of September. At least that has been the case 45 times over the past 66 years. During those 45 years, an average return of 9% was achieved. Only 21 times was an average loss of just over 7% recorded.
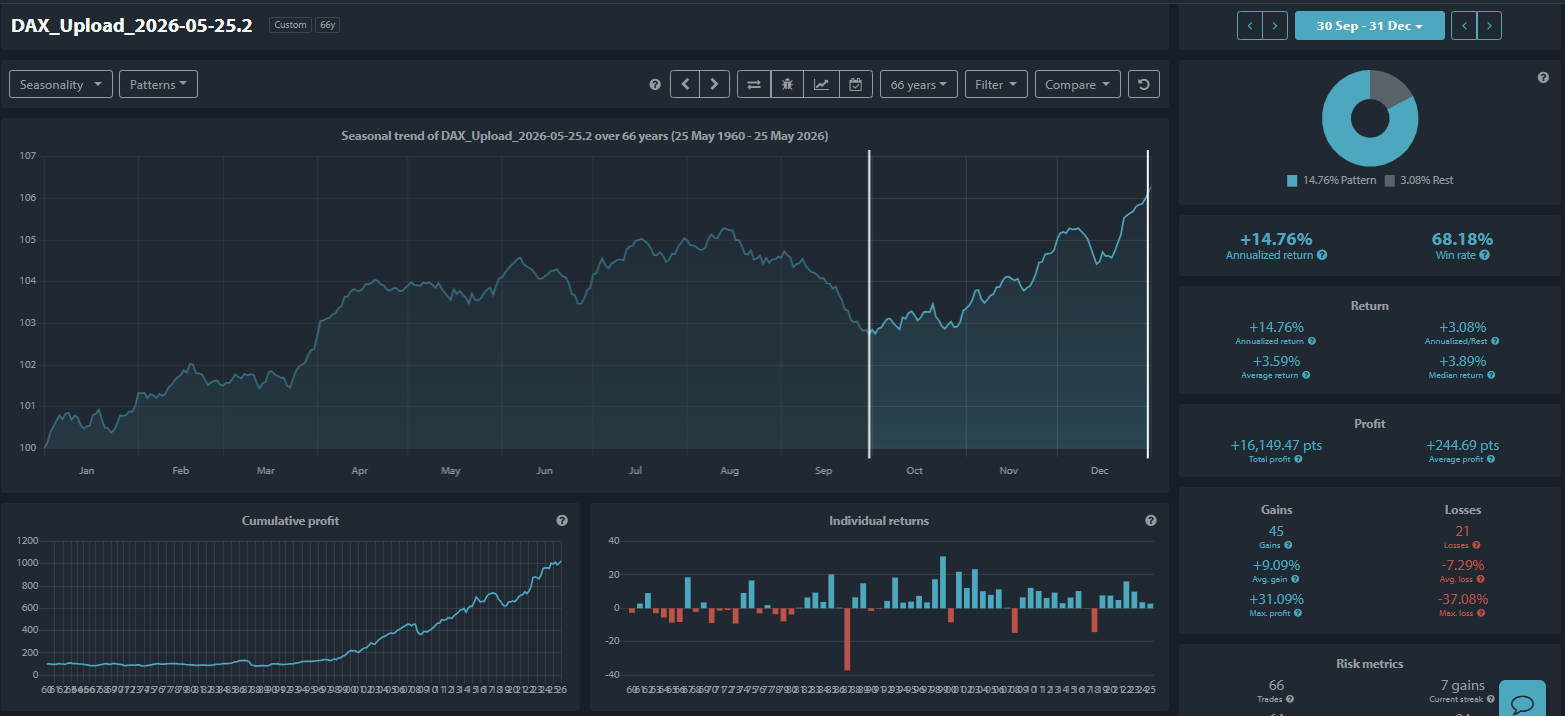
When the experts step up to the microphones in early December, disappointment usually isn’t long in coming, and over the next 40 years, there’s a downturn—albeit a brief one—that still amounts to a solid 2%.
The statistics are similarly interesting when, as is the case this year in Germany, it is a by-election year. In fact, in 11 out of 17 by-election years, an average gain of 11% is achieved.
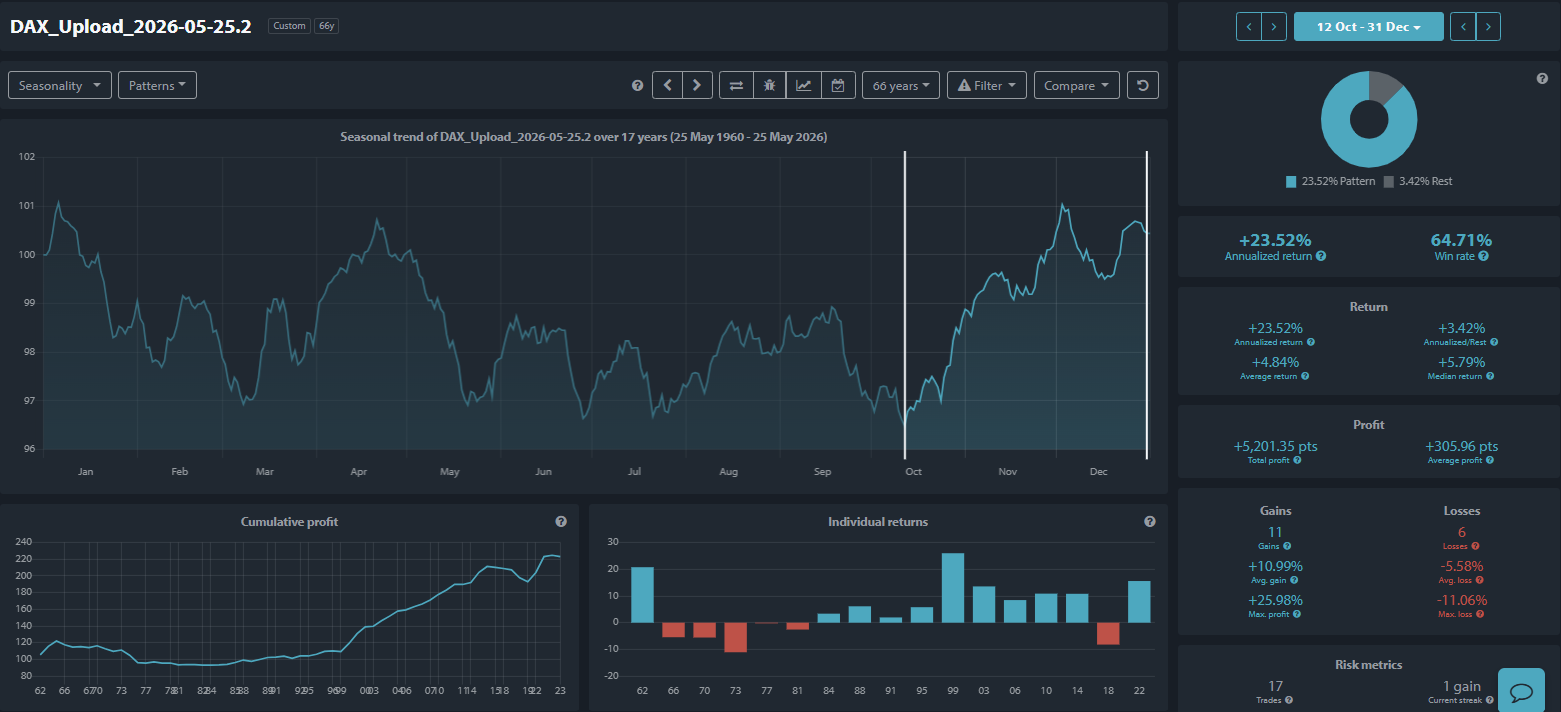
The disappointment among the December experts is likely to be even greater in years following a by-election, as the decline—from 5 to 12 percent and from 2 percent to 3 percent—is even more pronounced.
The U.S. also celebrates the year starting in October
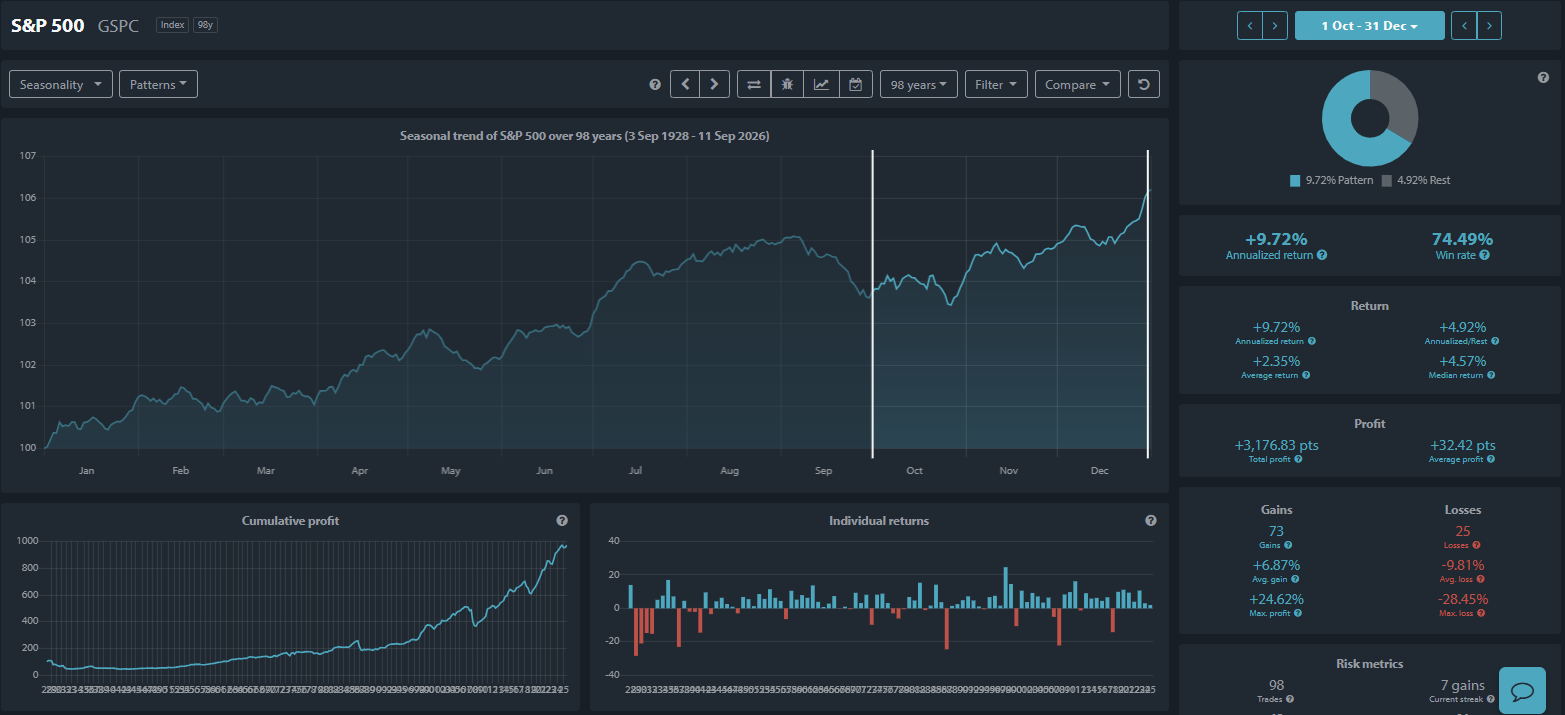
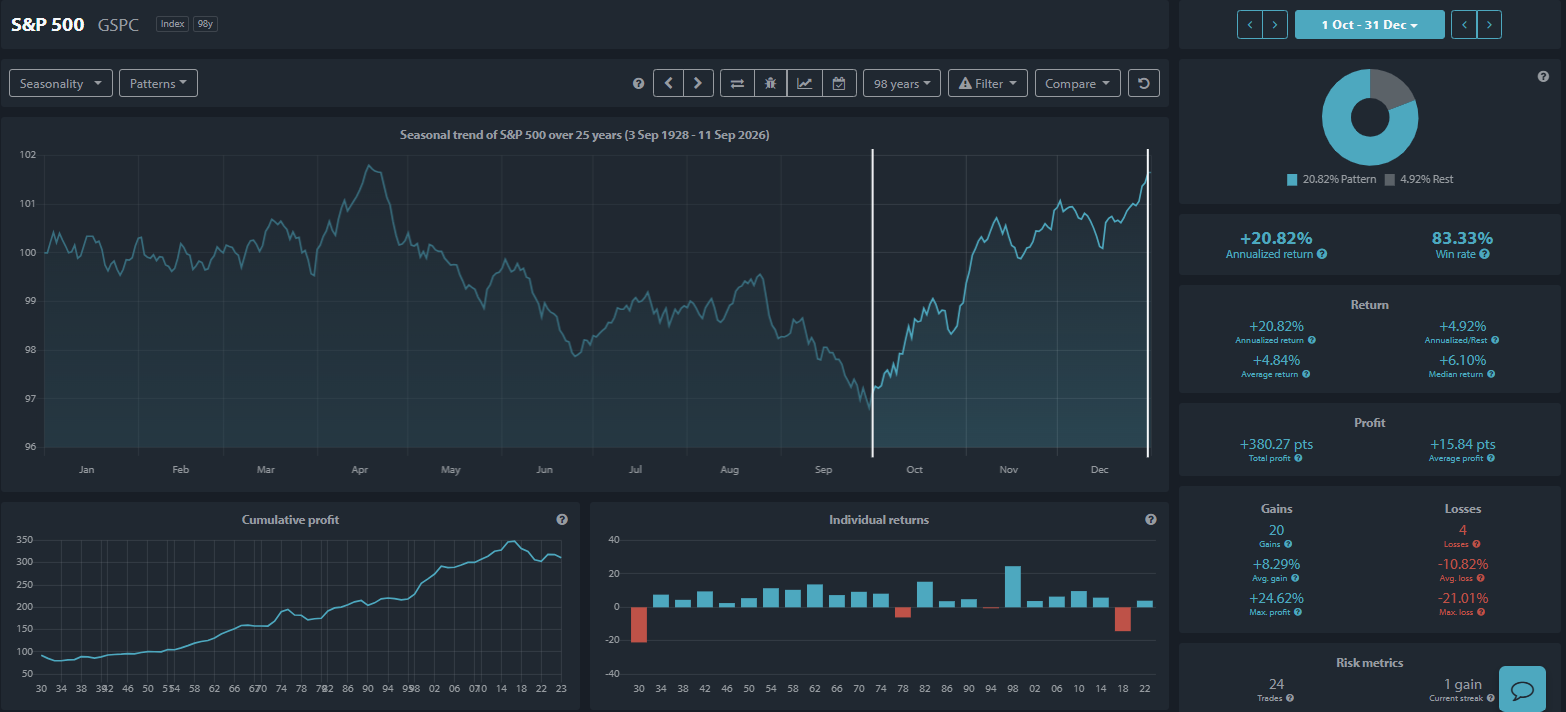
Even though the S&P 500 sometimes experiences setbacks in October, a significant upward trend can also be observed overseas through the end of the year. In 73 out of 98 years, investors who invested on October 1 closed the year with an average gain of just under 7%. Although an average loss of nearly 10% was incurred in the 25 negative years, most of the particularly poor years occurred a very long time ago, which is why adjusted statistics will be significantly better.
U.S. Midterm Election Years Are Exciting for More Than Just Politics
The current U.S. president has just kicked off the campaign for the midterm elections. This campaign is likely to be exciting, as it will not only be about seats in the House of Representatives and part of the Senate, but also, on a very personal level, about the president himself. If things go badly for him, he could become what is known as a “lame duck,” which means he would lose a significant amount of power.
The stock market, too, appears to be watching these elections very closely. Regardless of the election outcome, the period beginning October 1 will be even more significant than all other years combined.
In fact, in 20 of the last 24 midterm election years, investors were able to post an average gain of just over 8% by the end of the year. In the four years in which the statistics show a loss, an average of just over 10% was lost; however, the worst year among these four was back in 1930, so it can safely be ignored. Excluding that year, the average loss is only just over 7%.
So it looks like it’s going to be a heated fall—in all senses
This fall is shaping up to be particularly interesting—politically, but especially on the stock market—this year in particular. However, those who prefer short-term trading and only want to be invested for a few days might want to pick a very special time during the year-end rally. After all, the “Christmas rally” is nothing to sneeze at either.
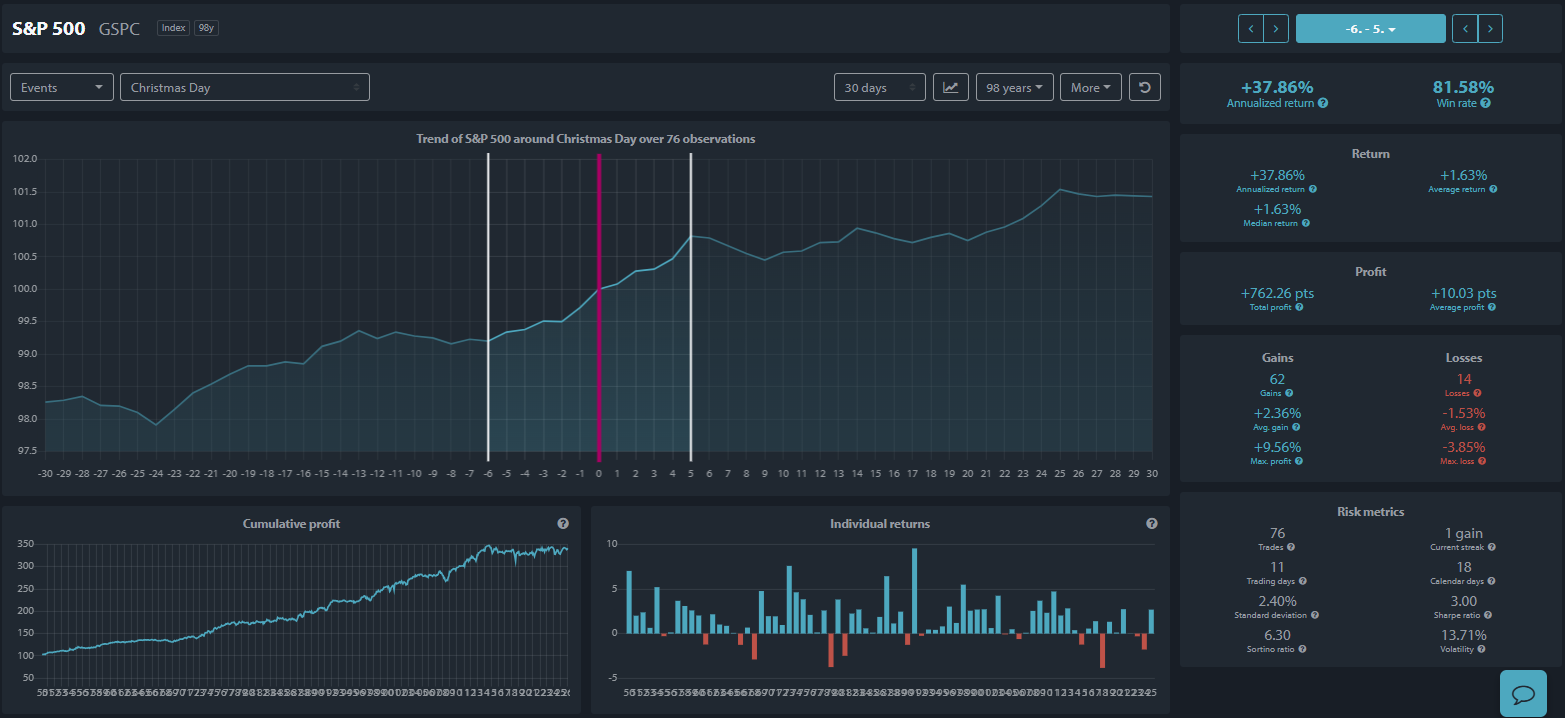
Seasonax’s event charts help identify these trends. Here, you can see excellent performance statistics from 6 days before through 5 days after Christmas. In the 62 years when the market performed well, a gain of 2.3% was achieved during these few days, while in the 14 years when the market underperformed, only 1.5% was lost. This is a probability ratio that is rarely seen.
Conclusion: Waiting for the “experts” in the media is not an option
After studying the Seasonax charts, it becomes clear that it’s not worth waiting until the media picks up on the year-end rally. Act early and secure the returns that the end of the year—and especially election cycles—have to offer.
This way, you may be able to afford slightly larger Christmas gifts than you had planned, even early on. Or you can simply use a portion of your profits to do some good and help those in need.
Seasonax wishes you every success.
Take advantage of these benefits and use Seasonax to professionally manage seasonal trends!
Sincerely,
Christoph Geyer, CFTe
Winner of the Stock Analyst Award for Technical Analysis