
Dear Investor,
You’ve surely heard of Black Friday or perhaps even taken advantage of it yourself. This day marks the start of the Christmas shopping season and is not only a time for special offers but also draws particular attention from the stock market. What does the shopping behavior of U.S. consumers look like this year when it comes to Christmas shopping?
Just a few days after this major shopping day, which is often treated as a long weekend in the U.S. following the Thanksgiving holiday, retailers begin announcing their initial results. This data is particularly important to stock market investors, as it provides insight into consumer spending patterns.
We examine these effects not only in relation to the overall market but also with regard to selected individual stocks. The results are sure to get investors hearts racing.
How does the U.S. market react to Black Friday?
To analyze this important shopping day for U.S. citizens, which also marks the start of the Christmas season, it’s best to look at the Thanksgiving holiday immediately preceding it. This can be easily analyzed using Seasonax. To do this, I first examined the S&P 500 over the past 25 years. Even here, a notable pattern emerges. An investment made 6 trading days before through 4 trading days after this “Black Friday” shows a distinctive ratio of 21 to 4. During these few days, an average gain of 2.6% can be achieved in the positive phases. The average loss during the four negative phases is limited to just 1.6% on average.
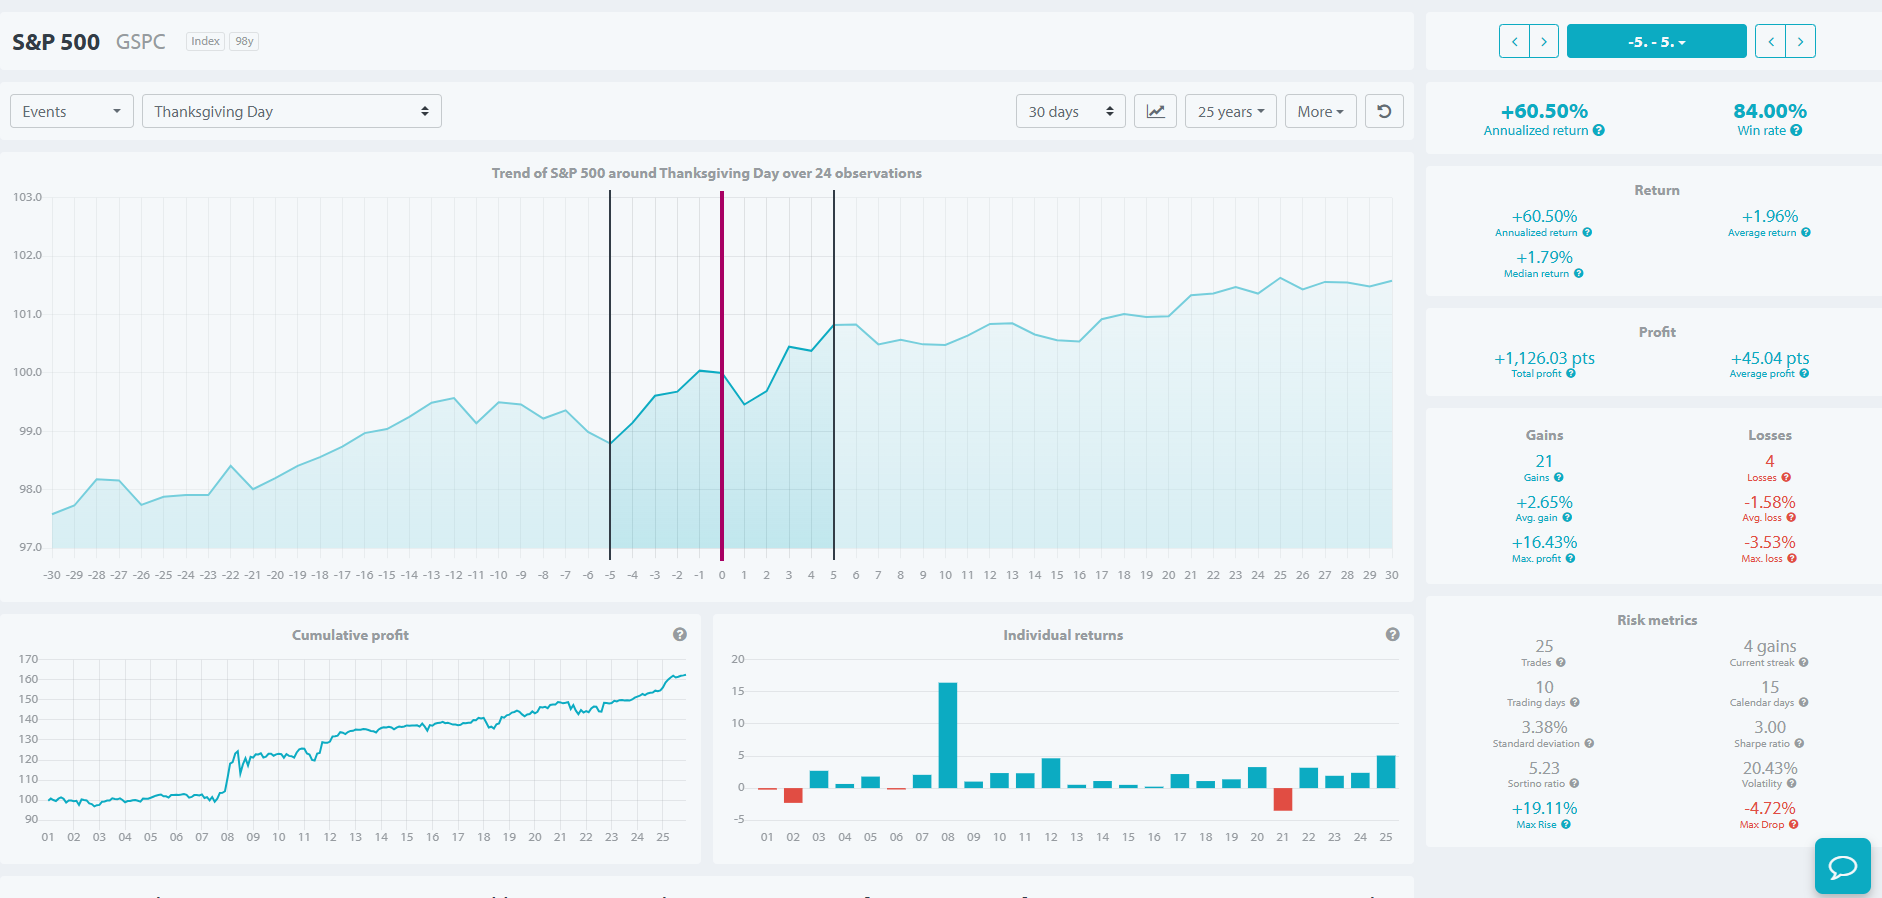
This market trend alone suggests that there must also be interesting individual stocks where the Black Friday effect can be leveraged. For this reason, I took a look at a few classic consumer stocks that should benefit from it.
Walmart is particularly popular due to its size
Even though the large department store chain hasn’t really been able to gain a foothold in Germany, the retail giant is a mainstay of the holiday shopping season in the U.S. The 30 trading days leading up to Thanksgiving and thus also to Black Friday show a ratio of 17 positive phases to 7 negative phases. The average return during the positive phases, at nearly 7%, is more than twice as high as the just under 3% loss during the negative phases.
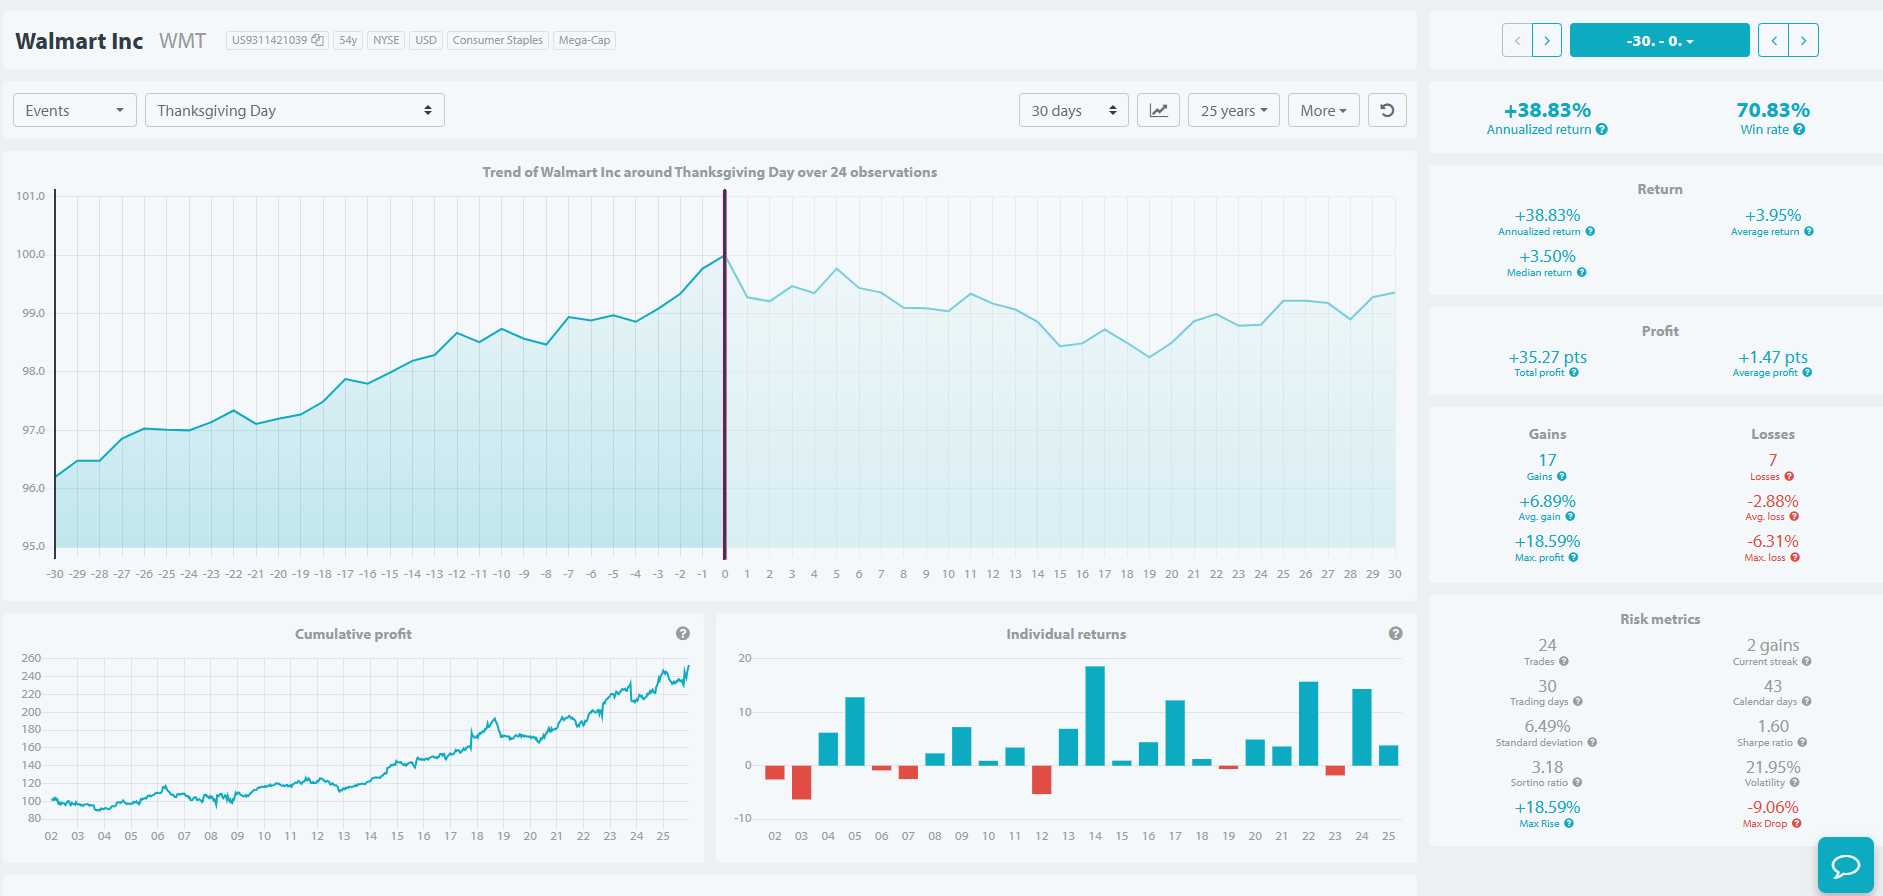
The most negative periods are already several years behind us. As a result, the likelihood of a profit has increased even further in recent years.
Costco Wholesale, an early indicator of consumer sentiment
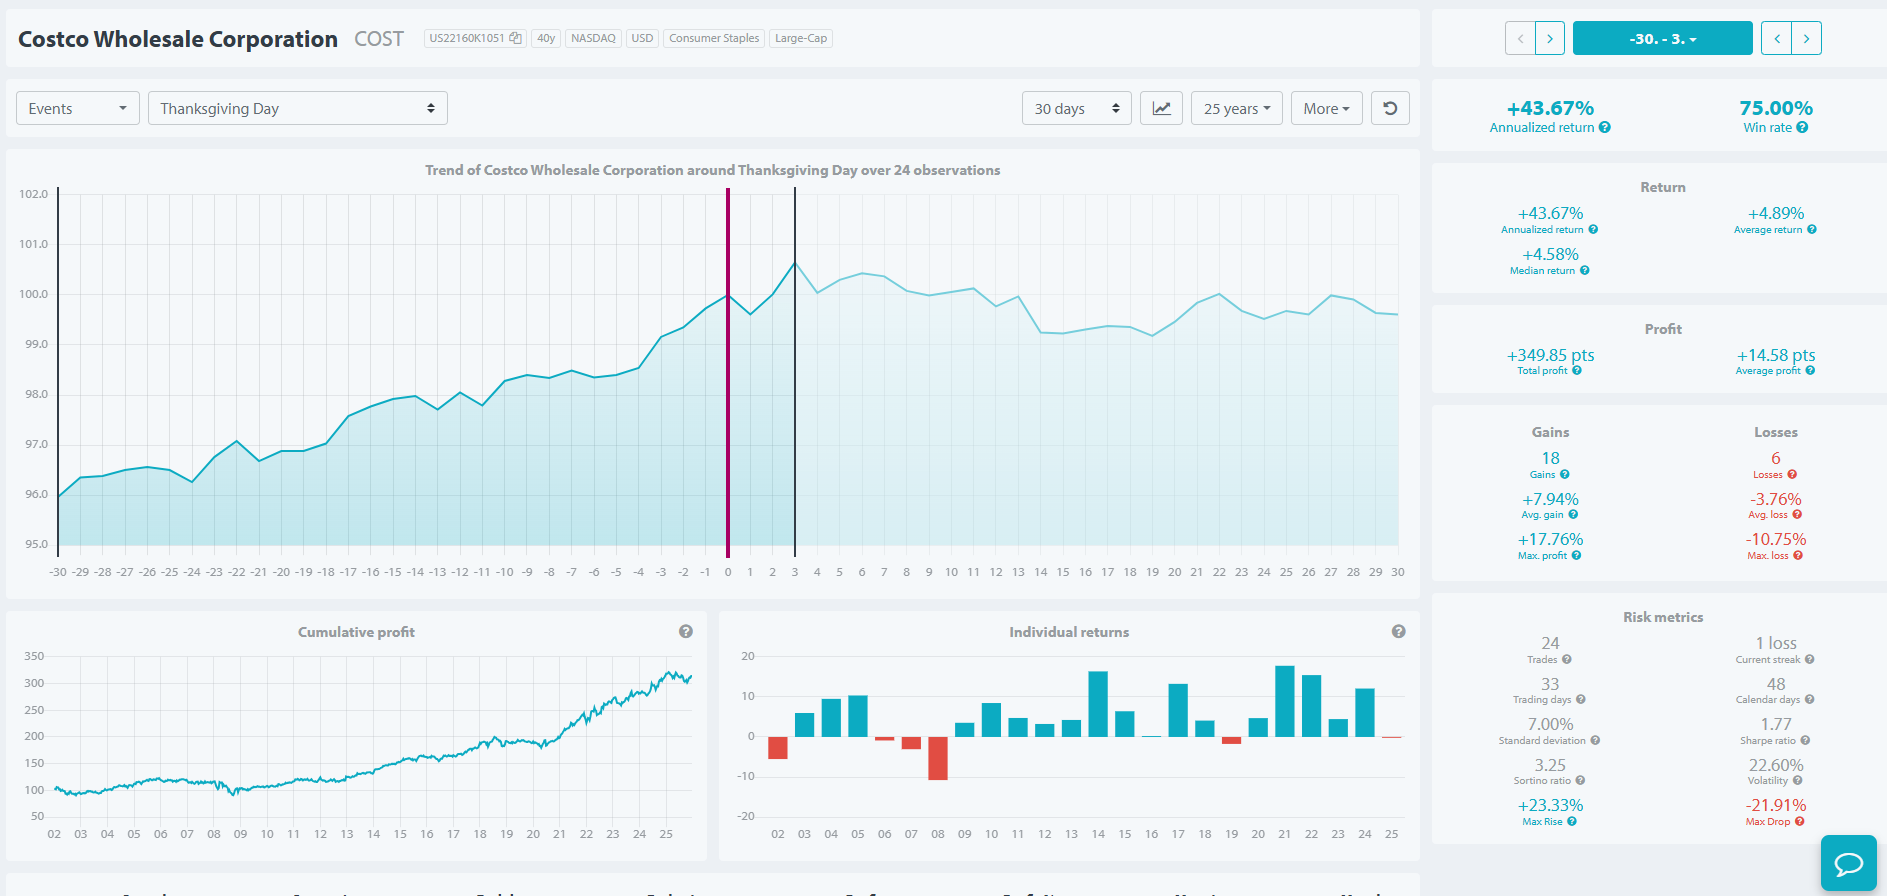
This retailer of seasonal goods, electronics, and gifts specializes in Christmas and, based on its monthly sales figures, indicates very early on whether a seasonal sales period will be successful. Costco’s stock performance leading up to Black Friday is slightly better than Walmart’s. During the 30-day period before and 3 days after Thanksgiving, there have been 18 positive phases with an average return of almost exactly 8%. Of the 6 negative phases, 4 occurred several years ago and resulted in an average loss of only 3.7%.
Macy’s Scores with Last-Minute Sales
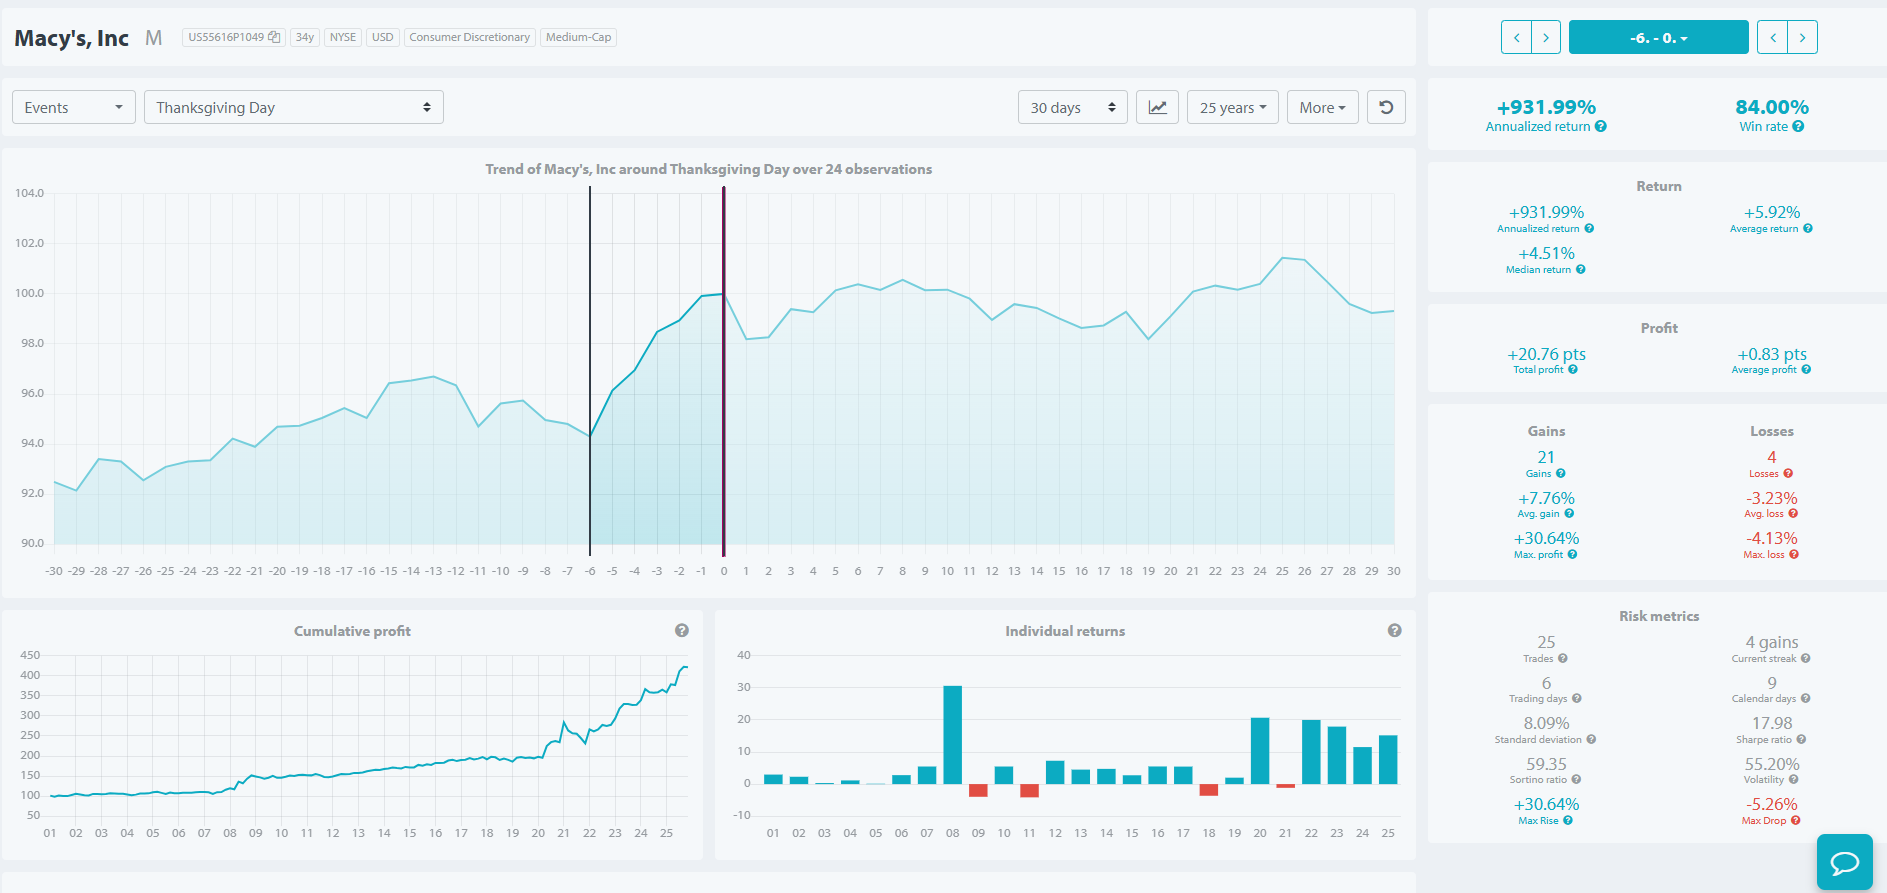
Macy’s is the quintessential provider of Christmas gifts, as the department store chain focuses on cosmetics, fashion, and jewelry. These classic gifts appear to be purchased primarily from the 6th trading day before Thanksgiving through Thanksgiving itself. During this short period, an average return of 7.7% has been achieved across 21 phases so far, whereas the other two strategies mentioned required significantly more time to achieve similar results. Losses are negligible, with only 4 phases resulting in an average loss of 3.2%.
Conclusion: Use seasonal trends to earn your own Black Friday discount
You can make excellent use of the pre-Christmas seasonal trends presented here to boost your holiday budget. The ratios and average returns support this, as does the very short holding period. This allows you to achieve a quick return that can be immediately translated into corresponding consumer spending.
Your loved ones will thank you if your stock market gains allow you to give them gifts that are a bit more lavish or creative.
Seasonax wishes you every success.
Take advantage of these opportunities and use Seasonax to professionally manage seasonal trends!
Kind regards,
Christoph Geyer, CFTe
Winner of the Stock Analyst Award for Technical Analysis