Dear Investor,
Artificial intelligence has been one of the dominant themes in markets over the past year. Most investors will naturally focus on software and platform companies, but what if the real opportunity is shifting elsewhere?
As we move deeper into 2026, the focus is increasingly turning toward what actually powers AI.
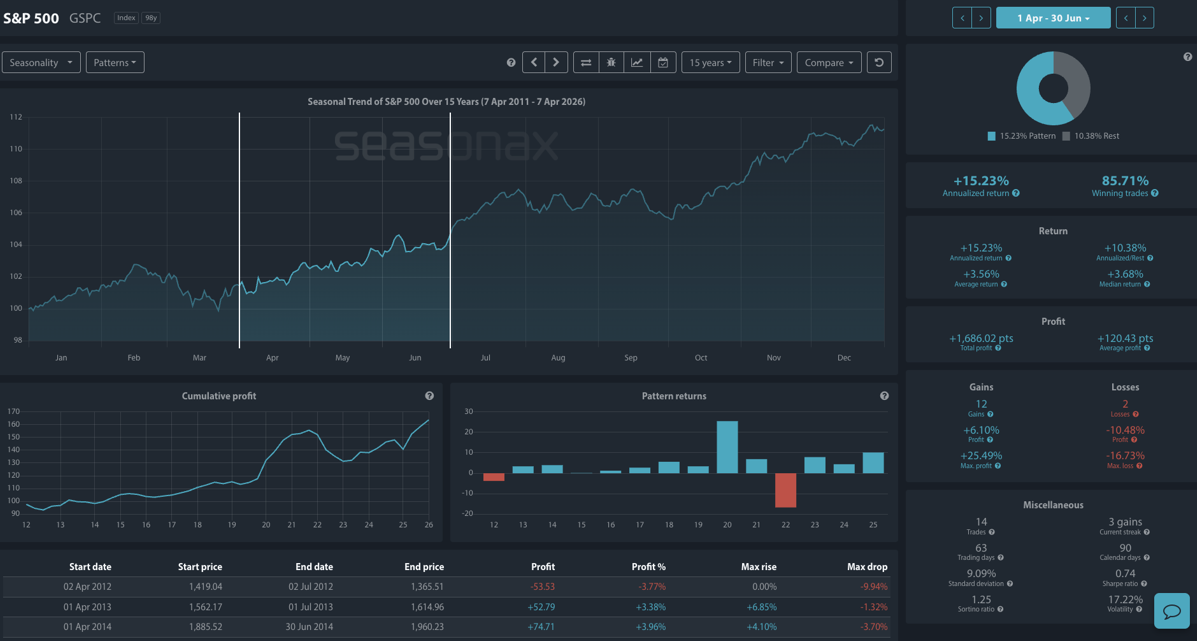
The chart below shows that over the last 15 years, the S&P 500 has produced an average return of +3.56% from 1 April to 30 June, with a win rate of just over 85% and an annualized return of +10.38%.
This is already a strong seasonal period for equities, but this year, there may be an additional layer to the story.
Why It Matters Now: AI Is Becoming Physical
The first phase of the AI boom was driven by software innovation. Now, the next phase is being driven by infrastructure investment.
AI systems are becoming more powerful and more demanding. As a result, the focus is shifting toward:
- Semiconductor capacity
- Data center expansion
- Energy and electricity supply
In simple terms, AI is no longer just a digital story – it is becoming an industrial one.
Seasonality Meets Structural Demand
What makes this idea particularly interesting is how it aligns with seasonality. The April to June period has historically been one of the strongest windows for equities, with consistent positive returns and a steadily rising cumulative profit curve. This creates a supportive backdrop where strong themes – like AI infrastructure – can gain traction more easily.
Trade Ideas: Positioning for the AI Infrastructure Cycle
With the focus shifting toward physical infrastructure, one name continues to sit at the center of this theme, Nvidia:
Semiconductors – The Core of AI Computing
Nvidia remains the dominant supplier of high-performance AI chips, and demand for GPUs continues to outstrip supply. As major technology firms expand AI capabilities, Nvidia sits directly at the center of this structural demand.
The chart below shows that over the last 15 years, Nvidia has produced an average return of +25.88% from 22 April to 30 August, with a win rate of 80% and an annualized return of +90.98%.
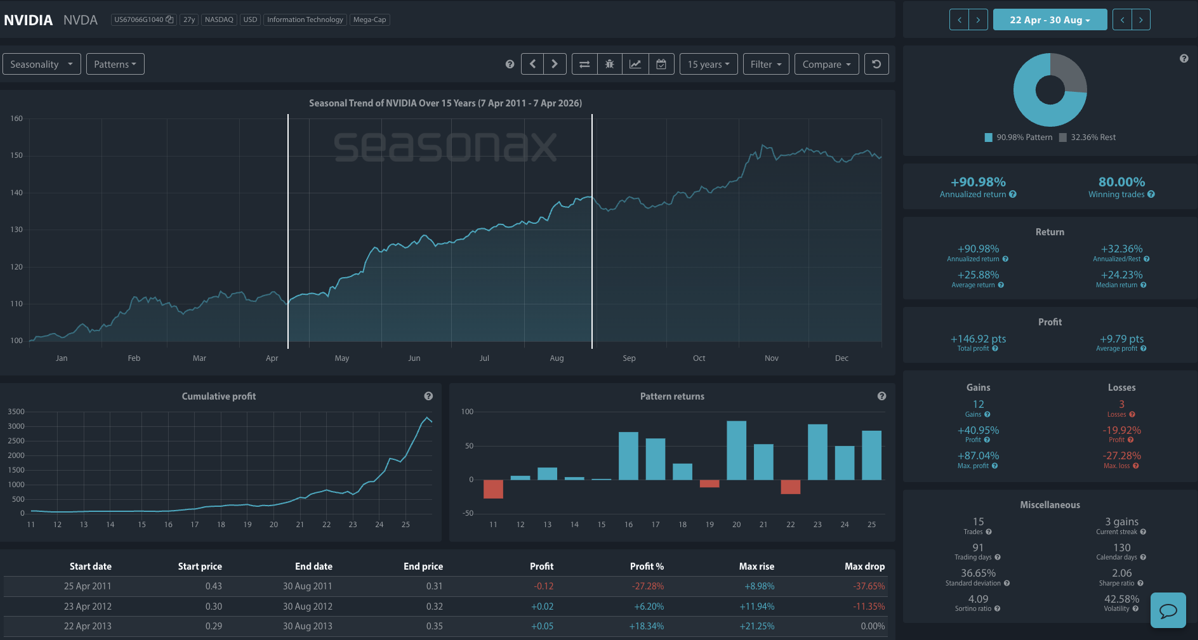
This is an exceptionally strong seasonal window, but be aware that the standard deviation is also very high, over 36%. So, this means that both wins and losses can be exceptionally volatile. The maximum drop was nearly 38% in 2011, so investors should also realize that losses can be large and not solely focus on the years that Nvidia has made +50% gains.
Broader Infrastructure Exposure
Beyond Nvidia, this theme extends across several key areas of the market:
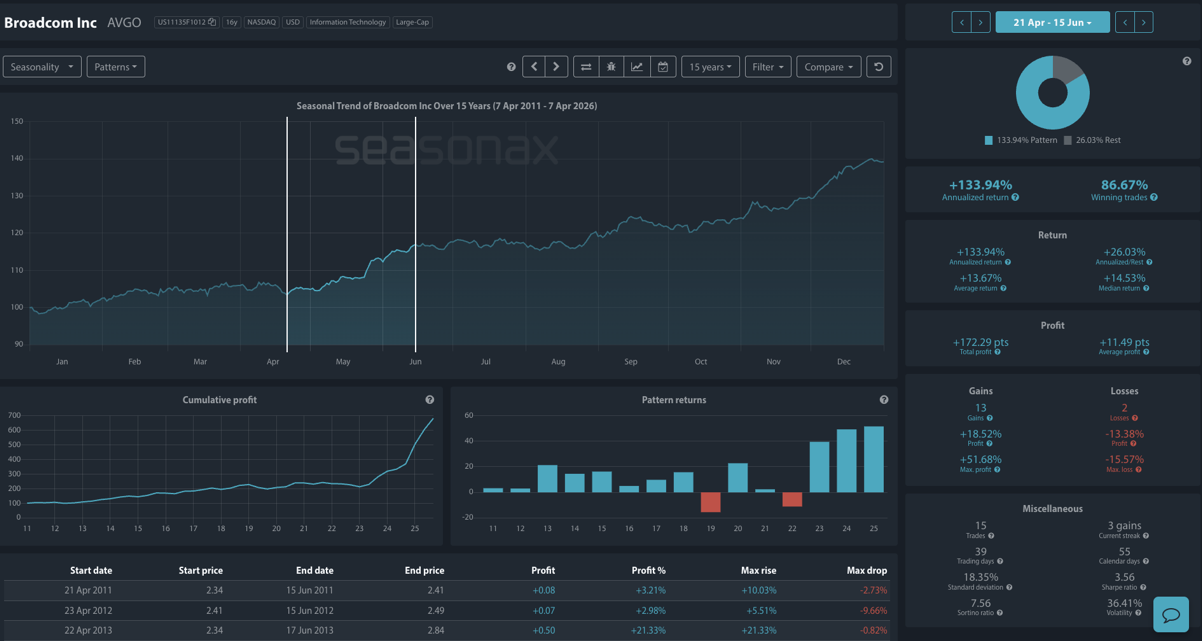
Semiconductor infrastructure, with Broadcom (AVGO)
The chart below shows that over the last 15 years, Broadcom has produced an average return of +13.67% from 21 April to 15 June, with a win rate of 86.67% and an annualized return of +133.94%. The last three years have seen gains of 39.59%, 49.36%, and 51.68%.
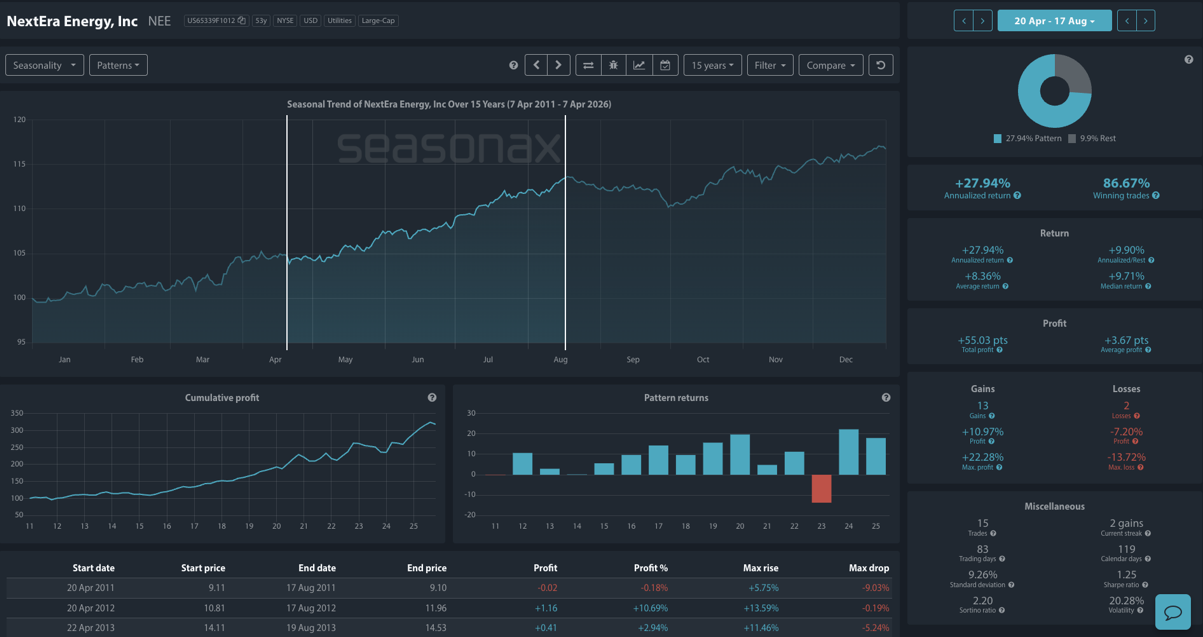
Utilities and power providers, such as NextEra Energy (NEE)
The chart below shows that over the last 15 years, NextEra Energy has produced an average return of +8.36% from 20 April to 17 August, with a win rate of 86.67% and an annualized return of +27.94%. The standard deviation is the least of the three patterns here indicating less volatile returns, although it is still high at 9.26%.
Data center and infrastructure companies
Benefiting directly from the surge in storage and computer demand, companies involved with the building, provision, and maintenance of data centers stand to see increased use of their services.
Together, these sectors form the backbone of the AI infrastructure buildout.
Trade Risks and Opportunities: A Structural Theme with Strong Seasonality
These seasonal patterns combine strong Q2 equity seasonality, exceptionally strong individual stock patterns (NVDA, AVGO, NEE), and a powerful structural demand story. If the first phase of AI was about software, the next phase may be about what powers it.
Of course, risks still remain. There is increasing valuation sensitivity in AI-linked equities, the threat of emerging policy or regulatory development, and supply constraints in both energy and materials. This is in addition to the high standard deviation/volatility of the highlighted patterns. Furthermore, the impact of the ongoing energy crisis due to uncertainty about access to the Strait of Hormuz may give the Federal Reserve reason to move towards interest rate hikes if the crisis lingers and inflation starts increasing again. The Federal Reserve next meet on April 29th.
However, the strength and consistency of these seasonal patterns, particularly the high win rates across all three assets, suggest that dips within this window may still continue to attract interested buyers.
Use Seasonax for your professional handling of market-moving events!
Don’t just trade it – Seasonax it.
Giles Coghlan, CMT
Macro Strategist Seasonax