The Fastest Growing Industries during the Corona Lockdown
Dear Investor,
As we have already discussed in previous issues of Seasonal Insights, there are still hidden gems in the market investors can benefit from against the backdrop of the corona crisis.
The dramatic changes caused by Covid-19 have created a number of opportunities, as e.g. some industries have become beneficiaries of people staying at home or working from home following the temporary closure of “non-essential” businesses to mitigate the spread of the corona-virus.
Sectors that have so far shown tremendous strength during the pandemic also include the biotechnology and pharmaceutical industries.
It may occur to you that the seasonality of the biotech and pharma sectors is fairly straight-forward, since there are times of the year when demand for certain drugs strengthens. For instance, the demand for medication against the common flu typically rises when temperatures in the western hemisphere begin to fall. As another example, demand for medication against hay fever typically increases in April or May.
In order to determine whether a typical seasonal pattern can actually be discerned in recent years, we have conducted a detailed analysis of the NASDAQ Biotechnology Index.
The NASDAQ Biotechnology Index is a stock market index composed of stocks of NASDAQ-listed companies classified according to the industry classification benchmark as either belonging to the biotechnology or the pharmaceutical industry.
NASDAQ Biotechnology Index
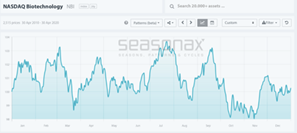
Unlike a standard price chart that simply shows a stock price pattern over a specific time period, a seasonal chart depicts the average price pattern of a stock or an index in the course of a calendar year, calculated over a number of years. The horizontal axis depicts the time of the year, while the vertical axis shows the level of the seasonal pattern (indexed to 100). With that in mind, let us examine the seasonal chart of NASDAQ Biotechnology Index, calculated over the past 15 years.
The NASDAQ Biotechnology Index started its recovery phase in mid-March, which incidentally coincides with a phase of seasonal strength as the seasonal chart shown below illustrates:
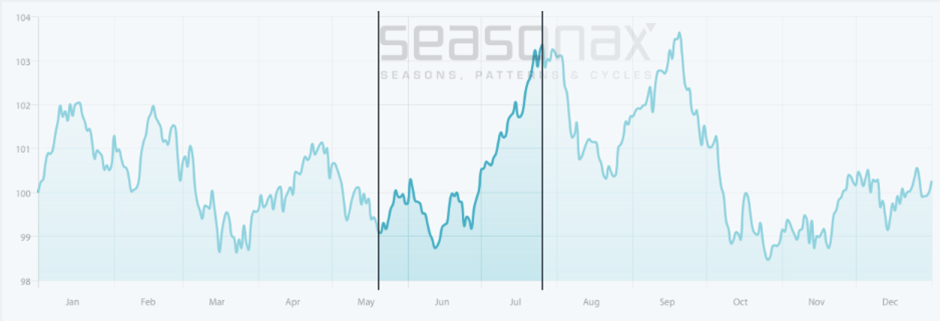
The NASDAQ Biotechnology Index typically delivers strong gains from mid-May to mid-July.
Source: Seasonax (click here to analyze the pattern)
I have highlighted the strongest seasonal phase from May 20 to July 26. On average, the NASDAQ Biotechnology Index has delivered a solid return of 6.78% during this time period, which corresponds to a very respectable annualized gain of 43.02%.
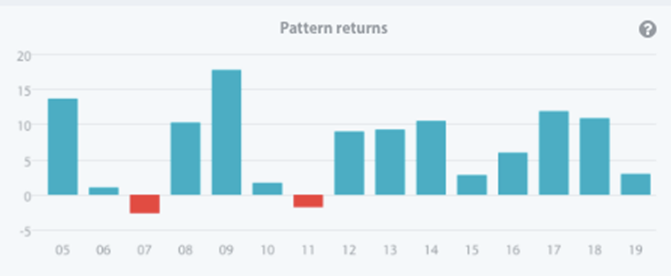
What is even more important is that the strong gains during this phase are generated very consistently – in other words, the pattern is historically highly reliable. This is detailed in the next chart.
The bar chart below depicts the return delivered by the NASDAQ Biotechnology Index in the relevant time period from May 20 to July 26 in every year since 2005. Red bars indicate years in which negative returns were generated, blue bars indicate years with positive returns.
The NASDAQ Biotechnology Index rose in 13 out of 15 cases; moreover, the drawdowns in the two losing years were quite moderate. All in all, the risk-reward characteristics of the strong seasonal phase are excellent:
Beginning of the Biotechnology and Pharmaceutical Era
In addition to examining the seasonality of the NASDAQ Biotechnology Index, we decided to analyze one of the constituents of the index as well, namely Sarepta Therapeutics, Inc. – a medical research and drug development company with corporate offices and research facilities in Cambridge, Massachusetts, United States.
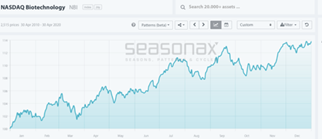
Sarepta Therapeutics, Inc., seasonal pattern over the past 10 years
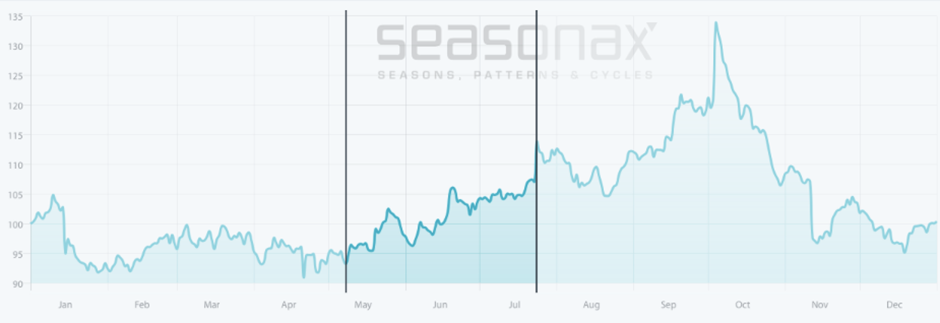
Sarepta Therapeutics, Inc. typically delivers strong gains from the beginning of May to the end of July.
Source: Seasonax (click here to analyze the pattern)
I have highlighted the strong seasonal phase from May 8 to July 24 in blue. In this time period Sarepta Therapeutics, Inc. displays a particularly strong seasonal advance. The average gain achieved in this period amounted to 31.3%. This corresponds to an extremely strong annualized gain of 264.87%!
In the past ten years the strong summer period typically continued until the first week of October. Please click on link above to analyze the rest of the period (so as to e.g. determine whether the additional gains were also achieved consistently or resulted from a statistical outlier).
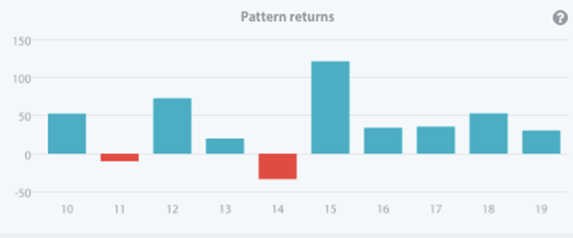
The following bar chart shows the pattern return for the time period May 8 to July 24 in every single year since 2010 – the stock has also generated gains in the vast majority of cases, namely in eight of the ten years under review.
Additional features of Seasonax
Take advantage of the various features available in the Seasonax app by e.g. comparing individual stocks to their industry benchmark in order to determine which stocks exhibit the strongest relative performance. Remember also to examine the de-trended versions of charts, which help to bring the seasonal patterns of very consistently trending stocks more clearly into relief.
Find unique opportunities with seasonal patterns
The NASDAQ Biotechnology Index consists of 213 constituents. Individual stocks often enjoy phases of seasonal strength, regardless of what is happening to the rest of the market. There are still a great many opportunities waiting to be discovered – even in an unusually challenging investment environment.
Take advantage of our free trial and discover a wealth of seasonal opportunities by yourself.
Yours sincerely,
Tea Muratovic
Co-Founder and Managing Partner of Seasonax